Investing.com’s stocks of the week
Shares of Bed Bath & Beyond (NASDAQ:BBBY) plunged yesterday, after the company revealed that its same store sales fell 5.4% for the recent holiday season. The stock dropped around 25% after the announcement, to close at $11.79.
While analysts had expected a decline of 4%, the greater than expected disappointment weighed on shares, which are now 85% below their record high of $80.82, hit during January 2014. The company blamed the declines on shrinking foot traffic, inventory management issues and additional markdowns and promotions used to drive sales.
CEO Mark Tritton, who joined the company in November and has been tasked with engineering a new strategy for the beleaguered domestic merchandise retailer said:
“We are experiencing short-term pain in our efforts to stabilize the business, including the pressures of store traffic trends coupled with our own executional challenges.”
Analysts believe Bed Bath & Beyond is facing more significant challenges than expected. "Tritton has a more difficult job ahead than we anticipated and more aggressive changes are needed," Cristina Fernandez, an analyst at Telsey Advisory Group, said Wednesday.
The stock reached a 52-week low of $7.31 on Aug. 15, 2019, after rising to its highest level in the past 12 months on April 10, when it traded at $19.57.

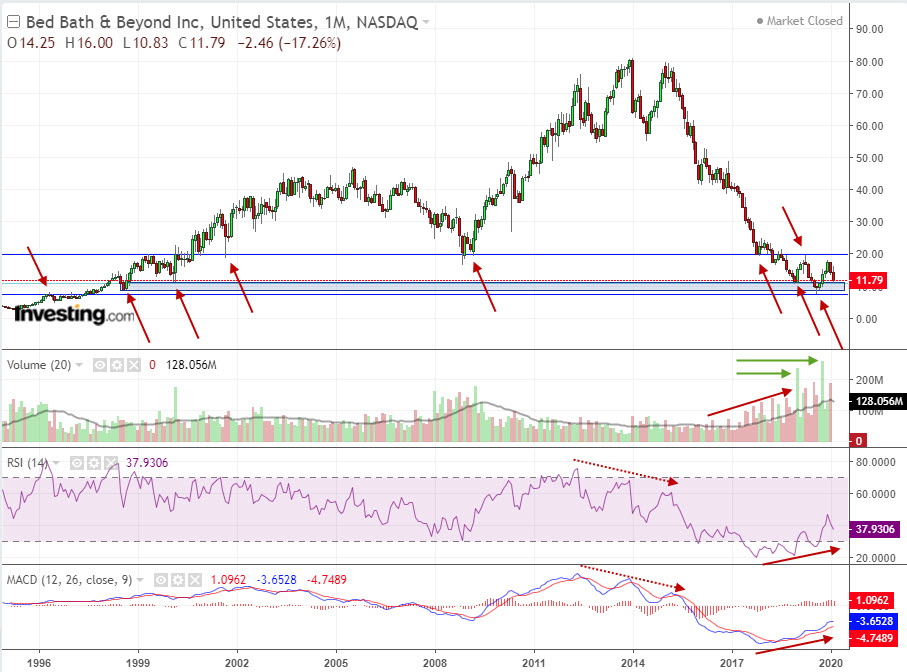
Historically, more than 20 years ago, the resistance level, which turned into support, was around the $7.30, with a second level around $20 (blue line). As well, there was a solid demand zone (light blue rectangle) between $8.70-$11.00.
Despite the recent, sharp drop, there are a pair of bullish signs on the monthly chart:
- Two huge volume spikes around the demand zone—in January and August 2019, indicating that buyers were waiting around this zone. Similarly, the current month's volume is also picking up nicely.
- Bullish divergences in volume, RSI, and MACD: while the price keeps dropping, each of these indicators are rising.

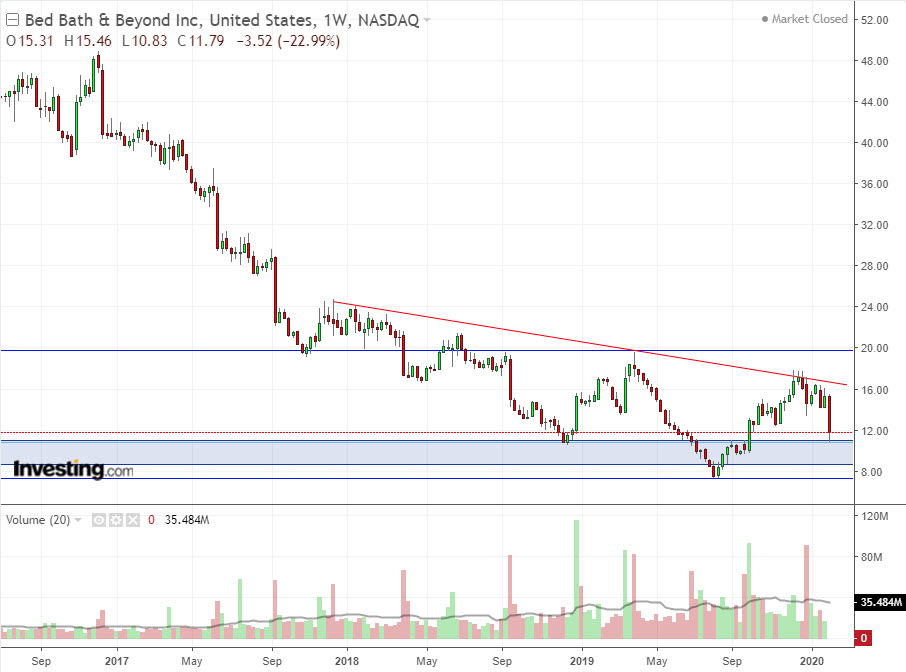
Here, on the weekly chart, is where we look for additional clues as to where the stock is headed next. Anyone in search of buy signals should be looking for confirmation on the weekly chart, in the form of a doji, hammer or a big marubozu candle, preferably with high volume, indicating buyer interest. Nothing like that has developed just yet, but it would be the tell.
Two resistance levels developing above are the downtrend line (in red) and the historical resistance line around $20 (blue). If the $11 level holds, a potential Head and Shoulders (H&S) pattern may form. This would be confirmed once the price breaks above its neckline, around $17.50.

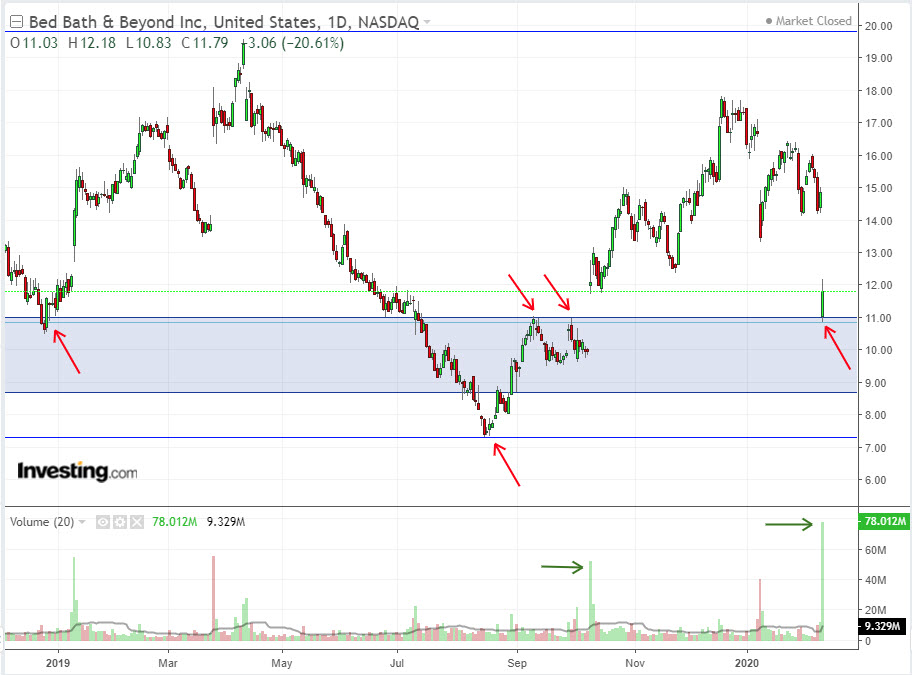
On the daily chart we can see that after the announcement yesterday, the stock opened at $11.03, to test the upper level of the historical demand zone. Eventually it closed at $11.76, completing a single-day drop of 20.61%. It's possible that in the weeks ahead the stock could test this demand zone. If it manages to stay above this zone, it may then retest the $20 level and perhaps even head beyond.
Should it go below the zone, it would suggest that available buyers took a bath on their existing BBBY holdings, sold off and went to bed.
