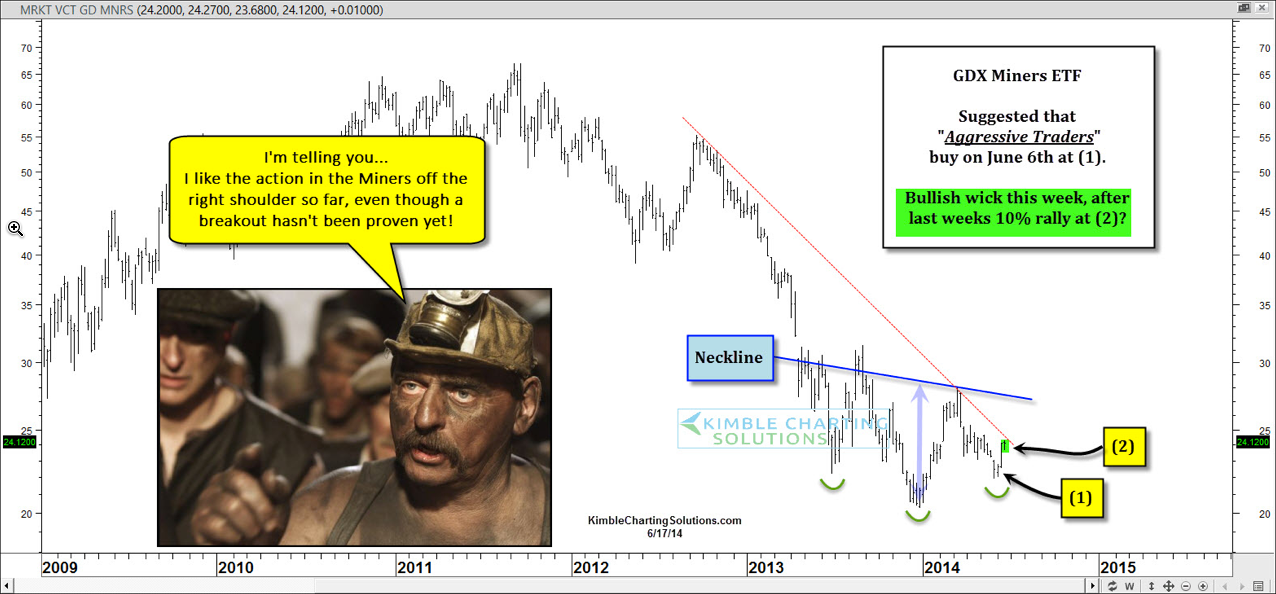
Since March I have been sharing with members that miners looked to be creating a bullish inverse head & shoulders pattern and that the right shoulder needed to be completed.
Premium and Metals members that are aggressive traders bought the miners (ARCA:GDX)/(ARCA:GDXJ) on June the 6 at (1) in the chart below. Last week a strong rally took place following a positive power of the pattern set up in the mining complex, with several mining index's moving 10% higher in five days.

Did last week's rally confirm that the bullish inverse head-and-shoulders pattern is completed? Not yet, in my humble opinion. So far I like what I see. I am sharing other resistance levels that I feel are key to keep this pattern going.
Power Of The Inverse Head-And-Shoulders Pattern
Natural Gas rallied 89% in 9 months off this inverse head-and-shoulders pattern two years ago this month (see NG H&S pattern here). Yields formed one last year and interest rates blasted off, jumping 37% in 7 months, hurting bonds big time (See Rate H&S pattern here).
This pattern has tons of potential, that's for sure. For it to be confirmed, other price action needs to take place.
