Is there really 100 years’ worth of natural gas beneath the United States?
The recent press about the potential of shale gas would have you believe that America is now sitting on a 100-year supply of natural gas. It’s a “game-changer.” A “golden age of gas” awaits, one in which the United States will be energy independent, even exporting gas to the rest of the world, upending our current energy-importing situation.
The data, however, tell a very different story. Between the demonstrable gas reserves, and the potential resources blared in the headlines, lies an enormous gulf of uncertainty.
The claim of a 100-year supply originated with a report released in April 2011 by the Potential Gas Committee, an organization of petroleum engineers and geoscientists. President and Chairman Larry Gring works with Third Day Energy LLC, a company based in Austin, Texas, that is engaged in acquiring and exploiting oil and gas properties along the Texas Gulf Coast.* Chairman of the Board Darrell Pierce is a vice president of DCP Midstream LLC, a natural-gas production, processing, and marketing company based in Denver. The report’s contributors are from the industry-supported Colorado School of Mines. In short, the Potential Gas Committee report is not an impartial assessment of resources.
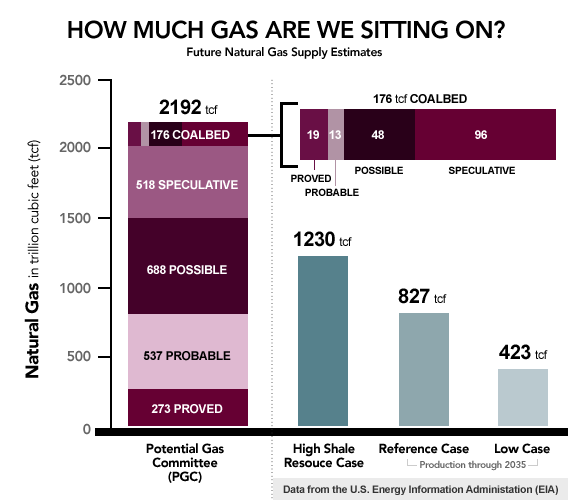
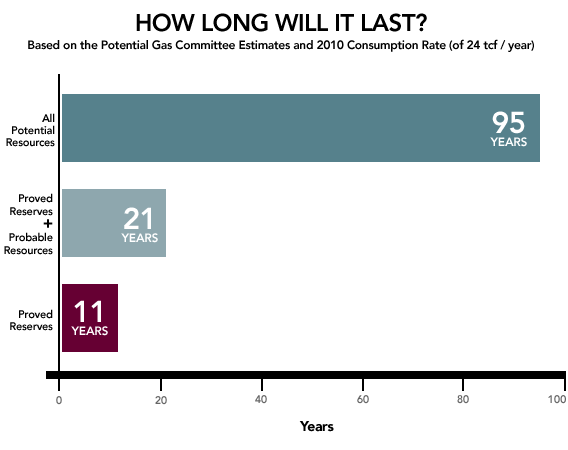
Its website consists of a single press release announcing the April report, with a link to a brief summary slide deck. A more detailed slide deck issued by the committee presents some optimistic estimates of potential resources, including a “future gas supply” estimate of 2,170 trillion cubic feet (tcf). At the 2010 rate of American consumption—about 24 tcf per year—that would be a 95-year supply of gas, which apparently has been rounded up to 100 years.
But what is that estimate based upon? Those details haven’t been made freely available to the public, but their summary breaks it down as follows here and in the graph below: 273 tcf are “proved reserves,” meaning that it is believed to exist, and to be commercially producible at a 10 percent discount rate. That conforms with the data of the U.S. Energy Information Administration. An additional 536.6 tcf are classified as “probable” from existing fields, meaning that they have some expectation that the gas exists in known formations, but it has not been proven to exist and is not certain to be technically recoverable. An additional 687.7 tcf is “possible” from new fields, meaning that the gas might exist in new fields that have not yet been discovered. A further 518.3 tcf are “speculative,” which means exactly that. A final 176 tcf are claimed for coalbed gas, which is gas trapped in coal formations. (Note: The PGC reports the total for probable, possible, and speculative coalbed gas as 158.6 tcf, but adding up their numbers for each category, we find the correct total is 157.7 tcf. We haven’t been able to reach the PGC to discuss the discrepancy. Adding the 18.6 tcf of proved coalbed gas reserves reported by the EIA in 2009—the most recent data it offers—to the 157.7 gives a total of 176.3 tcf for all categories of coalbed gas.
By the same logic, you can claim to be a multibillionaire, including all your “probable, possible, and speculative resources.”
Assuming that the United States continues to use about 24 tcf per annum, then, only an 11-year supply of natural gas is certain. The other 89 years’ worth has not yet been shown to exist or to be recoverable.
Even that comparably modest estimate of 11 years’ supply may be optimistic. Those 273 tcf are located in reserves that are undrilled, but are adjacent to drilled tracts where gas has been produced. Due to large lateral differences in the geology of shale plays, production can vary considerably from adjacent wells.
The EIA uses a different methodology to arrive at its resource calculations, offering a range of estimates. In the most optimistic, “high shale resource case,” it estimates there are 1,230 tcf in the “estimated unproved technically recoverable resource base.” It also offers several production forecasts through 2035, ranging from 827 tcf in their Reference case, to 423 tcf in their Low case—one-fourth the headline number. In the Low case, which certainly could be correct, the EIA says the United States could once again become a net natural-gas importer by 2035.
One complicating factor here is recoverability, because we are never able to extract all of an oil or gas resource. For oil, a 35 percent recovery factor is considered excellent. But recovery factors for shale gas are highly variable, due to the varied geology of the source rocks. Even if we assume a very optimistic 50 percent recovery factor for the 550 tcf of probable gas (536.6 tcf from shale gas plus 13.4 tcf from coalbed gas), that would still only amount to 225 tcf, or a 10-year supply. That plus the 11-year supply of proved reserves would last the United States just 21 years, at current rates of consumption.
Natural-gas proponents aren’t advocating current rates of consumption, however. They would like to see more than 2 million 18-wheelers converted to natural gas, in order to reduce our dependence on oil imports from unfriendly countries. They also advocate switching a substantial part of our power generation from coal to gas, in order to reduce carbon emissions. Were we to do those things, that 21-year supply could quickly shrink to a 10-year supply, yet those same advocates never adjust their years of supply estimates accordingly.
The truly devilish details of supply forecasts, however, rest in the production models of shale-gas operators.
Arthur Berman, a Houston-based petroleum geologist and energy sector consultant, along with petroleum engineer Lynn Pittinger, has long been skeptical of the claims about shale gas. Their detailed, independent work on the economics of shale-gas production suggests that not only are the reserves claims overstated, but that the productivity of the wells is, too.
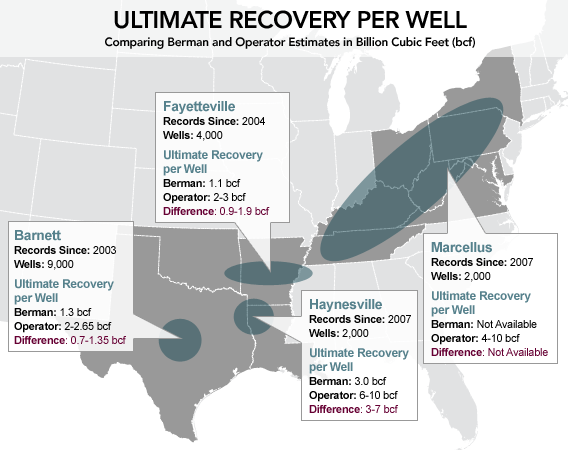
The problems begin with the historical production data, which is limited. The Barnett Shale in Texas is the only shale formation, or “play,” with a significant history. The first vertical well was drilled in 1982, but it wasn’t until the advent of horizontal drilling in 2003 that production really took off. By horizontally drilling and then “fracking” the rock with a pressurized slurry of water, chemicals, and “proppants” (particulates that hold open the fractures), operators kicked off the shale-gas revolution. Drilling exploded in the Barnett from about 3,000 wells in 2003 to more than 9,000 today. Thus we have a reasonably good data set for the Barnett. Data from the Fayetteville Shale in Arkansas are also reasonably substantial, dating back to 2004 and including roughly 4,000 wells. The data on the Haynesville Shale in Louisiana are minimal, dating to late 2007 and including fewer than 2,000 wells. The historical data for the rest of the major shale-gas plays—the Marcellus, Eagle Ford, Bakken, and Woodford—along with a handful of other smaller plays, are too recent and sparse to permit accurate modeling of their production profiles.
After mathematically modeling the actual production of thousands of wells in the Barnett, Fayetteville, and Haynesville Shales, Berman found that operators had significantly exaggerated their claims. Reserves appear to be overstated by more than 100 percent
Typically, the core 10 to 15 percent of a shale formation’s gas is commercially viable. The rest may or may not be—we don’t know at this point. Yet the industry has calculated the potentially recoverable gas as if 100 percent of the plays were equally productive.
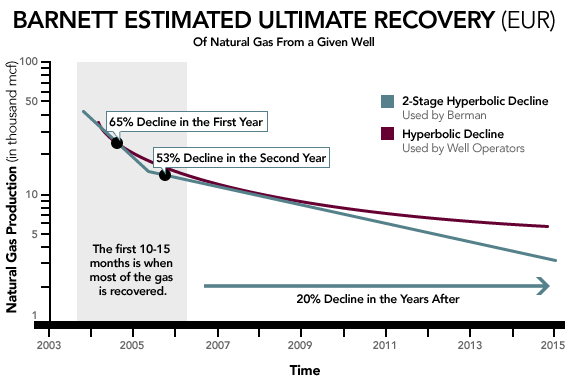
The claimed lifetime productivity, or estimated ultimate recovery, of individual wells was also overstated, Berman found. The production decline curves modeled by well operators predict that production will fall steeply at first, followed by a long, flattened tail of production. Berman’s analysis found a better fit with a model in which production falls steeply for the first 10 to 15 months, followed by an more weakly hyperbolic decline. Shale-gas wells typically pay out over one-half their total lifetime production in the first year. So operators must keep drilling continuously to maintain a flat rate of overall production.
Berman concludes that the average lifetime of a Barnett well might be as little as 12 years, instead of the 50 years claimed by operators, and the estimated ultimate recovery from individual wells might be one-half what is claimed. We will only know which models are correct after another five to 10 years for the Barnett, and more than a decade for the newer plays.
Other issues Berman identified include artificially inflating the average well productivity numbers by dropping played-out wells from their calculations; improperly including production data from restimulated wells as if it owed to the initial well completions; and intermixing data from older and newer wells without aligning the data by vintage, giving the impression of significantly higher-than-actual production overall.
Multiplying the error, operators seem to have applied their overly optimistic models of these older shale plays to newer plays, which may have radically different geological characteristics and might not be nearly as productive. For example, the lifetime output of Barnett wells may never be matched by wells in the Marcellus.
The EIA makes reference to all of these issues in its assessment of the prospects for shale gas, noting that “there is a high degree of uncertainty around the projection, starting with the estimated size of the technically recoverable shale gas resource,” and that “the estimates embody many assumptions that might prove to be untrue in the long term.” Yet none of these issues are properly accounted for in the official financial statements of the operators.
An example of how inflated initial resource claims can be, and how they can be sharply cut, presented itself in August with a new assessment of the Marcellus shale by the U.S. Geological Survey. It offered a range of estimates, from 43 tcf at 95 percent probability, to 84 tcf at 50 percent probability, to 114 tcf at 5 percent probability. (Not surprisingly, the 95 percent probable estimates have proven historically to be closest to the mark.) Only five months earlier, the EIA speculated in its Annual Energy Outlook 2011 that the Marcellus might have an “estimated technically recoverable resource base of about 400 trillion cubic feet.” The USGS reassessment had slashed the estimate for the Marcellus by 80 percent. Similar adjustments may be ahead for other shale plays.
In addition to the uncertainty about shale gas resources and productivity, there are other lingering questions. For one thing, on an averaged annual basis, shale gas has been unprofitable since 2008. Wildcatters—those who explore and sink the first wells in a new location—have been taking on a great deal of debt and risk to discover the plays and produce them at a loss, in hopes that larger, well-funded players will buy them out later. It’s not clear that this gamble will ever pay off.
The other major concern, of course, is about environmental contamination from fracking operations. It seems to me that the vast majority of shale-gas operations are as environmentally benign as the rest of the oil and gas industry’s operations, although some bad actors have, through negligence or outright irresponsibility, caused actual contamination. For now, though, the jury is out on the overall safety of shale gas production.
I am not anti-gas; neither is Berman. What concerns him, and me, are the overblown claims about the potential for shale gas and the poor quality of both technical and financial information about its production. We don’t yet know how much of the estimated gas resources will be economically recoverable or whether the projected production rates for some wells might be off by a factor of 10. We might have a 100-year supply of gas, or we might have an 11-year supply. We might realize economic and environmental benefits by transitioning trucking and coal-fired power generation to natural gas, or we might do so only to find ourselves out on a limb far more economically dangerous than the current peak and impending decline of world oil supply. We simply don’t know, and we may not know for years to come.
- English (UK)
- English (India)
- English (Canada)
- English (Australia)
- English (South Africa)
- English (Philippines)
- English (Nigeria)
- Deutsch
- Español (España)
- Español (México)
- Français
- Italiano
- Nederlands
- Português (Portugal)
- Polski
- Português (Brasil)
- Русский
- Türkçe
- العربية
- Ελληνικά
- Svenska
- Suomi
- עברית
- 日本語
- 한국어
- 简体中文
- 繁體中文
- Bahasa Indonesia
- Bahasa Melayu
- ไทย
- Tiếng Việt
- हिंदी
What the Frack?
Latest comments
Loading next article…
Install Our App
Risk Disclosure: Trading in financial instruments and/or cryptocurrencies involves high risks including the risk of losing some, or all, of your investment amount, and may not be suitable for all investors. Prices of cryptocurrencies are extremely volatile and may be affected by external factors such as financial, regulatory or political events. Trading on margin increases the financial risks.
Before deciding to trade in financial instrument or cryptocurrencies you should be fully informed of the risks and costs associated with trading the financial markets, carefully consider your investment objectives, level of experience, and risk appetite, and seek professional advice where needed.
Fusion Media would like to remind you that the data contained in this website is not necessarily real-time nor accurate. The data and prices on the website are not necessarily provided by any market or exchange, but may be provided by market makers, and so prices may not be accurate and may differ from the actual price at any given market, meaning prices are indicative and not appropriate for trading purposes. Fusion Media and any provider of the data contained in this website will not accept liability for any loss or damage as a result of your trading, or your reliance on the information contained within this website.
It is prohibited to use, store, reproduce, display, modify, transmit or distribute the data contained in this website without the explicit prior written permission of Fusion Media and/or the data provider. All intellectual property rights are reserved by the providers and/or the exchange providing the data contained in this website.
Fusion Media may be compensated by the advertisers that appear on the website, based on your interaction with the advertisements or advertisers.
© 2007-2025 - Fusion Media Limited. All Rights Reserved.
