Trade wars. Tariffs. Trump. One might think that the “Ts” are solely responsible for financial market volatility.
In truth, a wider variety of cross-currents are at work. Some have been bubbling up for a number of years.
Consider the debt profiles of investment grade corporations. Cash on the books relative to debt has deteriorated markedly, while gross leverage (debt-to-earnings) is sitting near an all-time peak.
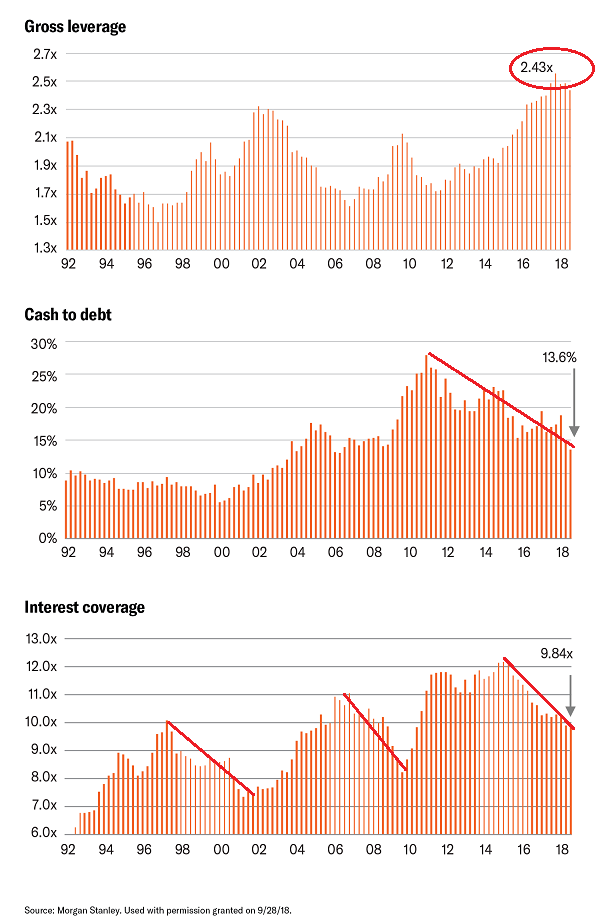
The trend for interest coverage is equally concerning. In 2015, roughly 8.3% of corporate income went toward paying interest on debts. Today? 10.2%. That means investment grade corporations are forking over 23% more for interest payments than they were just a few years earlier.
On the surface, of course, the interest coverage is sustainable. Beneath the surface, though, the trend (red line above) indicates we are nearing the completion of the business cycle.
The bond market is telling a similar story. Treasury yields across the curve – 2s, {{|3s}}, 5s, and 10s – presently trade below the Federal Funds Rate (FFR) of 2.38%.
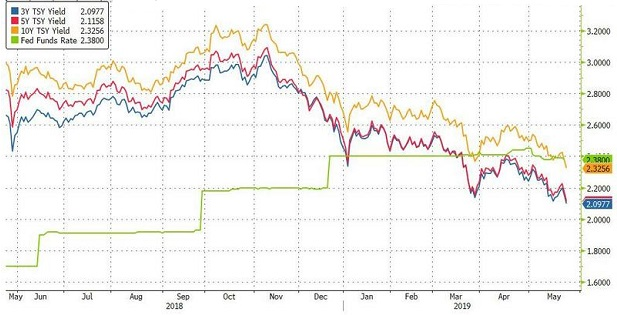
There are those who will tell you that the inversion of the yield curve is irrelevant. They’re sorely mistaken.
For one thing, inversion of 10-year maturities and 3-month maturities preceded seven of the last seven recessions going back to 1970. Believing that this time will be different is reckless in light of the fact that the current expansion is the longest in U.S. history.
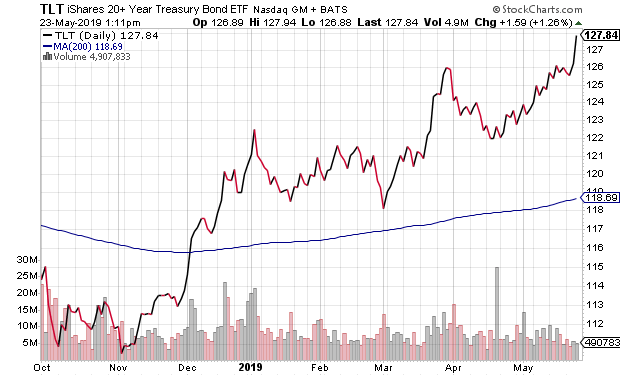
Secondly, the demand for longer-term government maturities is so strong relative to shorter-term maturities, it raises questions about the sustainability of the stock bull’s longevity, particularly in the midst of the longest stock bull in U.S. history. Instead, the bond market appears to be shouting that the macro-economic backdrop is only going to get weaker.
Granted, actual economic contraction may not be imminent. The 10-year-3-month inversion occurs, on average, 15 months before recessionary reality kicks in. Additionally, one occasion went as long as 34 months.
Nevertheless, asset prices tend to fall before the economic future takes shape. The bursting of the tech bubble in March of 2000 led to millions in layoffs well before the recession took hold in March of 2001. It follows that ignoring the credit cycle, where investment grade corporations are going to need to be more mindful of their balance sheets, and ignoring the yield curve inversion, which signals growth challenges for those very same companies, is ill-advised.
Not surprisingly, the real estate market is confirming what corporate debt concerns and yield curve inversion collectively tell us. Existing home sales have experienced 14 consecutive months of year-over-year declines.
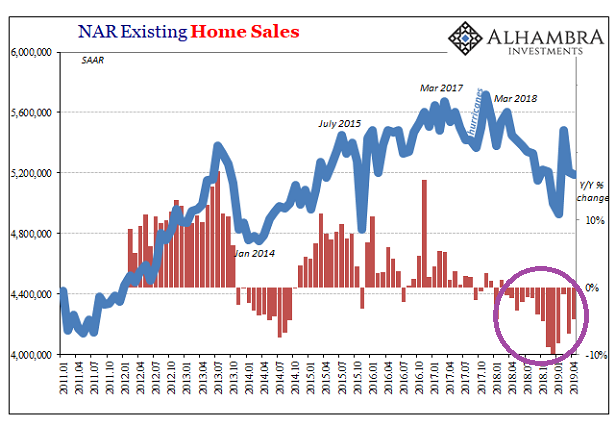
At first glance, one might be inclined to say that the slowdown is merely a function of the Fed’s rate hiking and quantitative tightening. After all, the 30-year fixed was hitting 5% in the 4th quarter of 2018.
On the other hand, we now find ourselves six months removed from early November when a 5% 30-year had become the norm. Those rates dropped rapidly into the early part of 2019 and are closer to 4% today. Why haven’t those existing home sales rebounded on the lower mortgage rates yet?
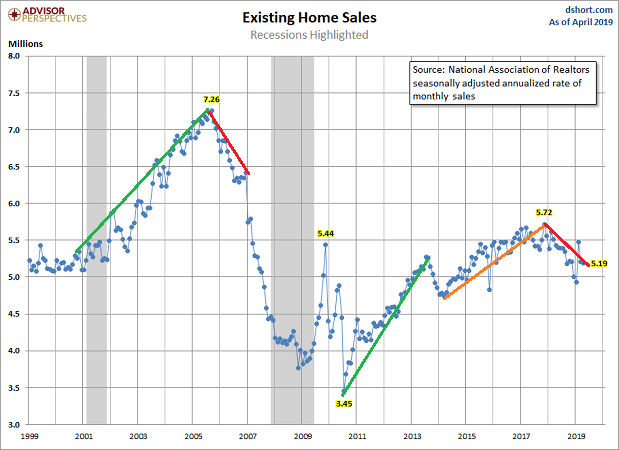
In my estimation, home prices have already risen to a point where a 4% 30-year is no longer stimulative. The average 30-year fixed in the current decade has been 4%, yet prices have skyrocketed. And that fact makes the cost of servicing the dream — principal, interest, tax, insurance — a bit prohibitive.
At this moment, both the bond market and the real estate market point to an economic slowdown in the very near future. On the flip side, the stock market continues to trade favorably. At least for now, the notions that the Federal Reserve would successfully bail out the markets (a.k.a. “Fed Put”) and that Trump would eventually forge a trade deal (a.k.a. “Trump Put”) keep stocks near record price levels.
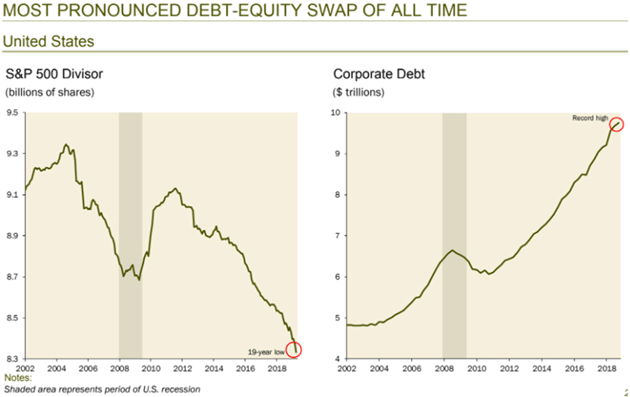
Still, if corporations are less capable or less willing to lever up with more debt, share buybacks could slow. And if there’s a need to shore up balance sheets to maintain more favorable credit ratings, dividend cuts might become necessary as well.
Stated another way, balance sheet improvement efforts would hurt stocks. Borrowing in the corporate bond market to reduce share count in the stock market could work its way backwards; that is, companies might even find themselves issuing shares in the stock market to pay down lofty debt levels.
Today, investors may want to be more vigilant with respect to the nature of their common stock exposure. They should look for higher quality balance sheets, lower price volatility, value and dividend growth. Stock ETF enthusiasts might want to investigate funds like iShares MSCI Quality Factor (NYSE:QUAL), iShares Core Dividend Growth (NYSE:DGRO) and Invesco Mid Cap Low Volatility (NYSE:XMLV).
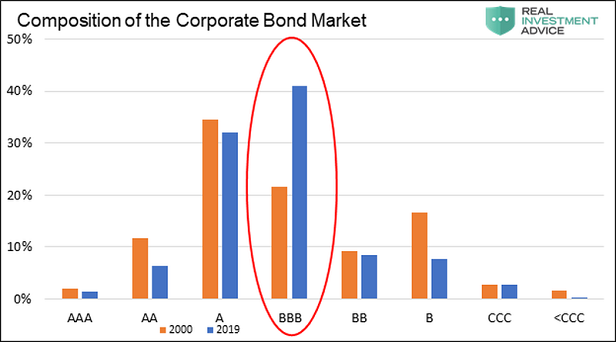
Additionally, it is sensible to be more mindful of credit quality in bonds and preferred stocks. For instance, rather than assume things will remain wonderful for the iShares Investment Grade Corporate Bond ETF (NYSE:LQD), ETF enthusiasts might want to look at iShares AAA-A Rated Corporate Bond (NYSE:QLTA). With BBB-rated bonds comprising 50% of the investment grade corporate bond world (40% of the total), a large percentage of these would be downgraded to “junk/high yield” in the next recession. You would not want to be holding LQD if and when there’s a massive shift in its holdings.
