With the myriad of players moving in and out of the Crude Oil markets and its affiliate or component products Heating Oil and Unleaded Gasoline, it becomes a definitive benefit to reference a “larger picture” view. This helps determine the trend and prevents countertrend trading when the markets move into a transition from one level to the next. Keeping the larger trend in focus removes some misaligned hesitation, allowing us as traders to “participate” not “anticipate”. Keeping the larger trend in focus puts and keeps in perspective, the direction of “runners”. Trades that carry the potential and probability of posting 20, 30 or 40+ tick gains.
Bear in mind that while I continue to advocate trading without caring about the who, what, where, when and how, I do advocate the benefit of establishing the trend both on an intraday basis and then on an hourly and daily basis. Having somewhat of an understanding of the above mentioned adverbs as they pertain to trading and being more specific day trading, is useful.
In previous posts, I have discussed the Elliott Wave count that has been underway in crude oil off of the 2008 highs at $147.27. The monthly and weekly charts continue to follow a clear path that keeps the longer term trend down for now. The current “bounce” off of the 26 level lows seen in January is best viewed as a 4th wave correction within an ongoing larger 5 wave sequence down. This larger 5 wave sequence down will complete the “C” wave down of the larger A-B-C decline off of the $147.27 high.
So, to recap progress thus far: Wave “A” down began in July 2008 and completed at January 2009 low at $33.20. Wave “B” rallied back to the high in August 2013 at $112.25. From that point then wave “C” has been unfolding and has thus far completed waves 1 – 4, which completed at high in May 2015 at 62.58. Wave 5 of “C” will ultimately form it’s own 5 waves as it completes the larger parttern. Within wave “5” of “C” internal waves 1-3 are complete and a smaller 4th wave bounce has been underway of the 26.05 low in February 2016.
While the potential remains in place that this smaller 4th wave is complete at last weeks 34.21 high the possibility of a finishing rally back above the 36 level remains in the picture for now. Another possibility is that crude is forming a triangle pattern which will keep it in a tight trading range between 34.35 and 29.50 before completing and thrusting the market lower as the final decline begins.

Back to today’s post title; the “What” last week was the contract roll out of March into April for both options and futures. This week the focus appears to be back on the “crack” spread. Wikipedia defines the crack spread as follows:
“Crack spread” is a term used in the oil industry and futures trading for the differential between the price of crude oil and petroleum products extracted from it – that is, the profit margin that an oil refinery can expect to make by “cracking” crude oil (breaking its long-chain hydrocarbons into useful shorter-chain petroleum products).
In the futures markets, the “crack spread” is a specific spread trade involving simultaneously buying and selling contracts in crude oil and one or more derivative products, typically gasoline andheating oil. Oil refineries may trade a crack spread to hedge the price risk of their operations, while speculators attempt to profit from a change in the oil/gasoline price differential. – Source Wikipedia © 2016
The “Who” would be oil refining companies and the wealthy families that gleaned all their wealth from “black gold”. Yes, I do have a few specific players in mind, but I’ll save that for another conversation. Referring again to Wikipedia for a more pronounced description we can begin to put together the whole picture:
For integrated oil companies that control their entire supply chain from oil production to retail distribution of refined products, there is a natural economic hedge against adverse price movements. For independent oil refiners which purchase crude oil and sell refined products in the wholesale market, adverse price movements can present a significant economic risk. Given a target optimal product mix, an independent oil refiner can attempt to hedge itself against adverse price movements by buying oil futures and selling futures for its primary refined products according to the proportions of its optimal mix.
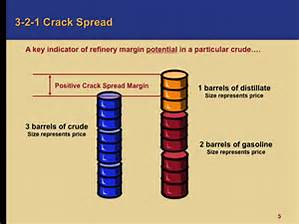
For simplicity, most refiners wishing to hedge their price exposures have used a crack ratio usually expressed as X:Y:Z where X represents a number of barrels of crude oil, Y represents a number of barrels of gasoline and Z represents a number of barrels of distillate fuel oil, subject to the constraint that X=Y+Z. This crack ratio is used for hedging purposes by buying X barrels of crude oil and selling Y barrels of gasoline and Z barrels of distillate in the futures market. The crack spread X:Y:Z reflects the spread obtained by trading oil, gasoline and distillate according to this ratio. Widely used crack spreads have included 3:2:1, 5:3:2 and 2:1:1.[1] As the 3:2:1 crack spread is the most popular of these, widely quoted crack spread benchmarks are the “Gulf Coast 3:2:1” and the “Chicago 3:2:1”.[citation needed
The following discussion of crack spread contracts comes from the Energy Information Administration publication Derivatives and Risk Management in the Petroleum, Natural Gas, and Electricity Industries:[3]
Refiners’ profits are tied directly to the spread, or difference, between the price of crude oil and the prices of refined products. Because refiners can reliably predict their costs other than crude oil, the spread is their major uncertainty. One way in which a refiner could ensure a given spread would be to buy crude oil futures and sell product futures. Another would be to buy crude oil call options and sell product call options. Both of those strategies are complex, however, and they require the hedger to tie up funds in margin accounts.
To ease this burden, NYMEX in 1994 launched the crack spread contract. NYMEX treats crack spread purchases or sales of multiple futures as a single trade for the purposes of establishing margin requirements. The crack spread contract helps refiners to lock-in a crude oil price and heating oil and unleaded gasoline prices simultaneously in order to establish a fixed refining margin. One type of crack spread contract bundles the purchase of three crude oil futures (30,000 barrels) with the sale a month later of two unleaded gasoline futures (20,000 barrels) and one heating oil future (10,000 barrels). The 3-2-1 ratio approximates the real-world ratio of refinery output—2 barrels of unleaded gasoline and 1 barrel of heating oil from 3 barrels of crude oil. Buyers and sellers concern themselves only with the margin requirements for the crack spread contract. They do not deal with individual margins for the underlying trades.
An average 3-2-1 ratio based on sweet crude is not appropriate for all refiners, however, and the OTC market provides contracts that better reflect the situation of individual refineries. Some refineries specialize in heavy crude oils, while others specialize in gasoline. One thing OTC traders can attempt is to aggregate individual refineries so that the trader’s portfolio is close to the exchange ratios. Traders can also devise swaps that are based on the differences between their clients’ situations and the exchange standards. – Source, Wikipedia © 2016.
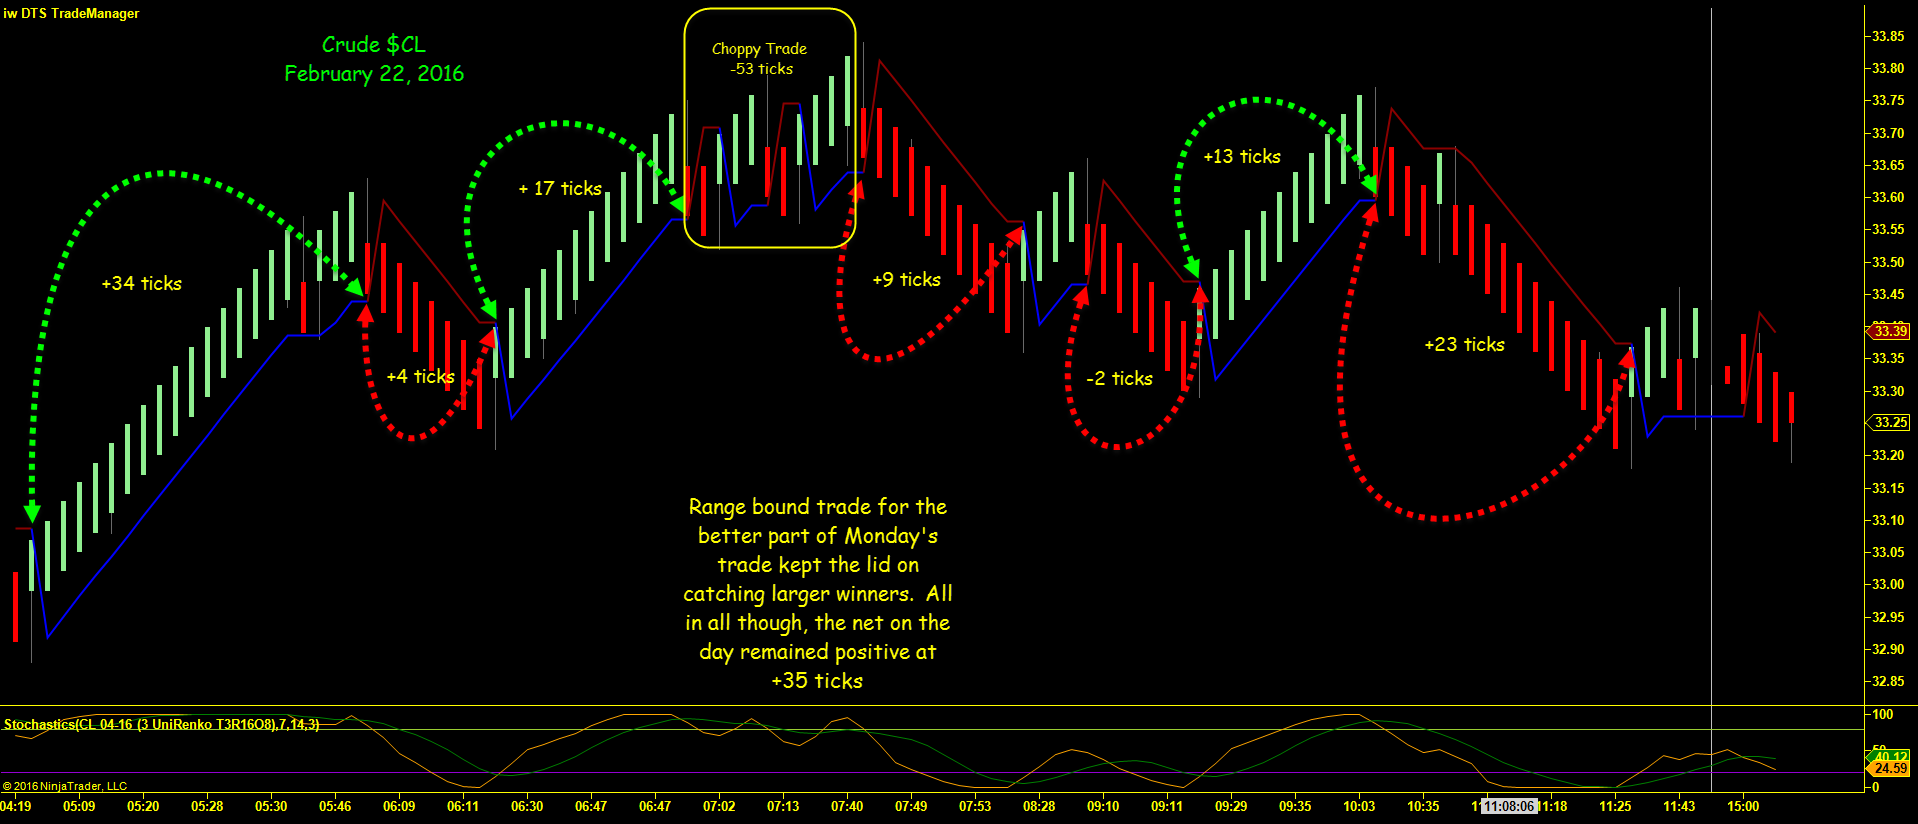
Putting on or taking off large positions can create problems as the depth of the market, in heating oil and unleaded gasoline is much thinner than crude. Recent news seems to point to a shift in the supply/demand equation creating a situation where larger players need to adjust positions. On Monday, the bulk of trading in April crude was between 33.68 and 33.38, a relatively small range within the 223 tick intraday range, but a tradeable range when taking into consideration the trend was “up”
Check out yesterday’s CL chart for trades and discussion:

