Do investors really understand the economy or the business cycle? The recent surge in the market indices questions whether the markets believe there is a relationship.
Follow up:
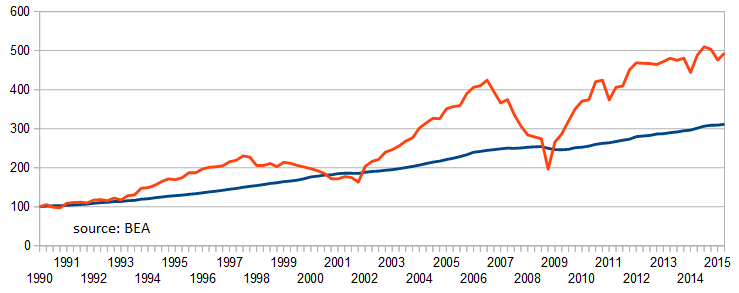
As I have said many times in the past - there do not need to be short term correlations between the economy and the markets. There are millions of reasons why the markets go one way, and the economy goes the other way. Looking at corporate profits indexed since 1990 shows corporate profits have advanced at nearly double the rate of Gross Domestic Income improvement. Clearly profits had been growing much faster than the economy.
Corporate Profits (red line) vs. Gross Domestic Income (blue line) indexed to 1990
But since the Great Recession (aka New Normal), there is a much tighter correlation between corporate profits and economic growth.
Corporate Profits (red line) vs. Gross Domestic Income (blue line) indexed to 2007
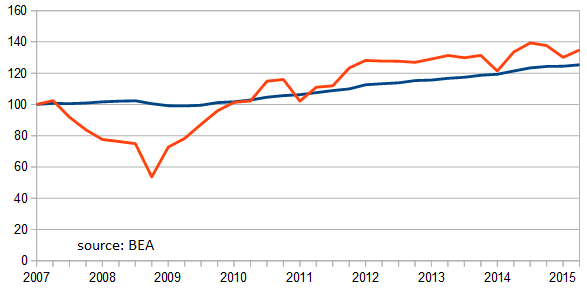
The new normal would suggest the market pay closer attention to Gross Domestic Income as a guide to market valuation. As the market is forward looking, knowing the economic situation months from now is necessary. It seems most forecasters are projecting economic growth around 2.8% over the coming 12 months - and this would suggest likewise that the market rise over the next 12 months should be in this range also.
This past week we issued our economic forecast which remains at one of the lowest levels since the end of the Great Recession. Our economic forecast is designed as a measure of Main Street - not as a forecast for GDP. However there are correlations as can be seen on the below graphic.
GDP Year-over-Year Growth (red line) vs Econintersect Economic Index (blue line)
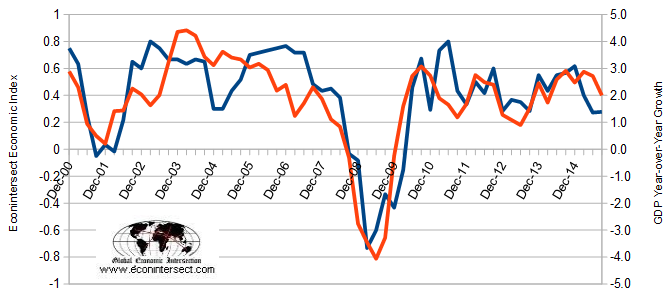
Econintersect believes looking at year-over-year growth is a better way at looking at GDP - and our economic forecasts are based on year-over-year growth. In addition, our forecasts are issued four months in advance of GDP publication.
From all the evidence we are seeing - economic growth will be moderate at best over the next six months. Market valuation (based on New Normal historical correlations) should follow this moderate growth.
Other Economic News this Week:
The Econintersect Economic Index for November 2015 marginally improved - but remains in the low range of index values seen since the end of the Great Recession. The most tracked sectors of the economy generally showed some growth. Still our economic index remains in a long term decline since late 2014. Our employment six month forecast continues to forecast weakening employment growth.
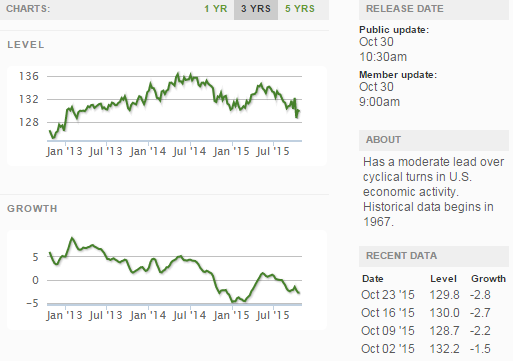
The ECRI WLI growth index is now in positive territory but still indicates the economy will have little growth 6 months from today.
Current ECRI WLI Growth Index
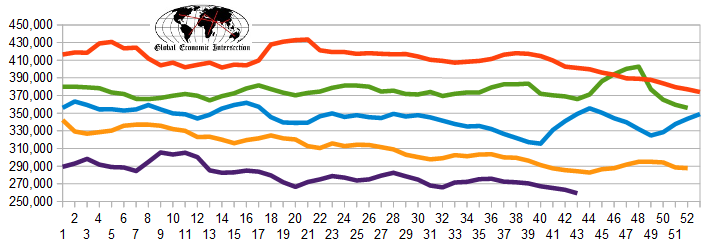
The market (from Bloomberg) was expecting the weekly initial unemployment claims at 245 K to 270 K (consensus 265,000) vs the 259,000 reported. The more important (because of the volatility in the weekly reported claims and seasonality errors in adjusting the data) 4 week moving average moved from 265,250 (reported last week as 265,000) to 263,250. The rolling averages generally have been equal to or under 300,000 since August 2014..
Weekly Initial Unemployment Claims - 4 Week Average - Seasonally Adjusted - 2011 (red line), 2012 (green line), 2013 (blue line), 2014 (orange line), 2015 (violet line)
Bankruptcies this Week: RAAM Global Energy
Click here to view the scorecard table below with active hyperlinks
Weekly Economic Release Scorecard:
