The US Dollar gains a lot of attention whenever anyone talks, trade, politics or the macro picture. So this year with “Trade Wars”, tariffs, political polarization, and rising interest rates, it is at the forefront of discussion. There is a lot of pushing and pulling going on with the US Dollar. The media will often give us the perspective of those who shout the loudest. That is not helpful with the complexity involved. So best to look at the price action.
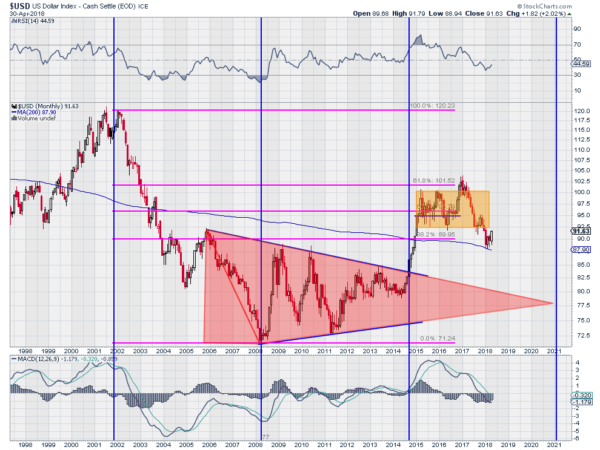
The chart below shows over 20 years of monthly price action for the US Dollar. It gives a very interesting picture of what may be in store for the greenback. The first thing to note is the the two 6 year ranges marked by the vertical lines. You can also go back further and see the period leading into 2002 was also a 6 year range.
 In each of these ranges the US Dollar has trended. First up, then down then sideways. It is about halfway through the current 6 year period that started moving higher. But the price action since 2017 makes one question if the 6 year pattern may be over.
And it might be. But also look at the rest of the picture. To start the period it quickly moved back over its 200 month SMA, made a nearly 61.8% retracement of the downward period and then stalled. Coming in to the start of 2018 it had pulled back to retest that 200 month SMA, held and reversed. This would be a first signal of potentially more upside to come.
Both the RSI and MACD have also reset at the lower end of positive ranges and are turning back up. This is another signal for a push higher. Currently the Dollar is retesting the bottom of the consolidation zone (orange box). With over a years worth of price battles fought in this area there are some anchored positions here. A move into and then through this range would be very significant.
Finally, a move over the top of the range, to a higher high, would also trigger a potential Gartley harmonic, with a Potential Reversal Zone (PRZ) at a 78.6% retracement or 109.75. The 6 year cycle in the US Dollar may not be over yet. The signs are there for continuation. A break of that 200 month SMA would change that.
The information in this blog post represents my own opinions and does not contain a recommendation for any particular security or investment. I or my affiliates may hold positions or other interests in securities mentioned in the Blog, please see my Disclaimer page for my full disclaimer.
