The euro slid lower throughout 2014 and into 2015. Many (including me) were discussing the possibility of it reaching parity with the dollar or worse. But it has been as stubborn as a mule since. February, clinging to the 110 area. Is that the end of the slide?
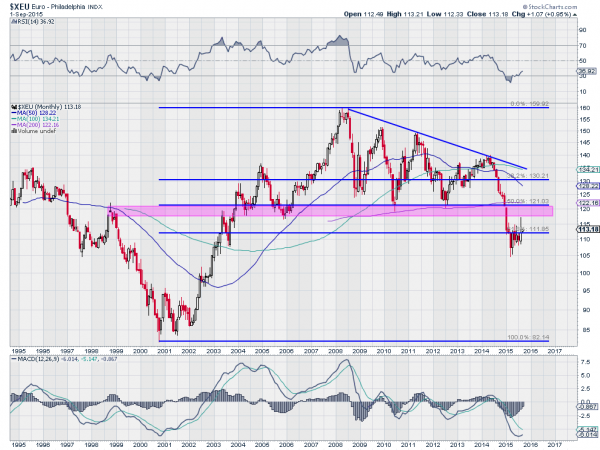
My guide has been the very long term monthly chart on the euro. Below you can see that it moved below a descending triangle in December that brought it down below 113. This is where it has stalled. But the move falls short of the target from the triangle break at 80 by a long shot. We know the technical target gives possibilities not certainties, so maybe that is all for the decline.

Notice that it also sits at a 61.8% retracement of the major leg higher form 2000 to 2008. A stall here is a natural place for the currency to settle. On a shorter time frame, the spike higher in August tested the bottom of the breakdown zone. The momentum has shifted as well. The RSI has moved up off of oversold indication and is rising with the MACD curling up, but not yet crossed.
So is this the reversal? It is too early to tell. It would be quite natural for the euro to retest the breakdown area and then sell off further, down to parity or lower. The current consolidation measured on a break lower now ads a second target at 80. These 2 targets at 80 now would be negated on a break back over 121 and continuation. Until then, the trend remains lower.
The information in this blog post represents my own opinions and does not contain a recommendation for any particular security or investment. I or my affiliates may hold positions or other interests in securities mentioned in the Blog. Please see my Disclaimer page for my full disclaimer.
