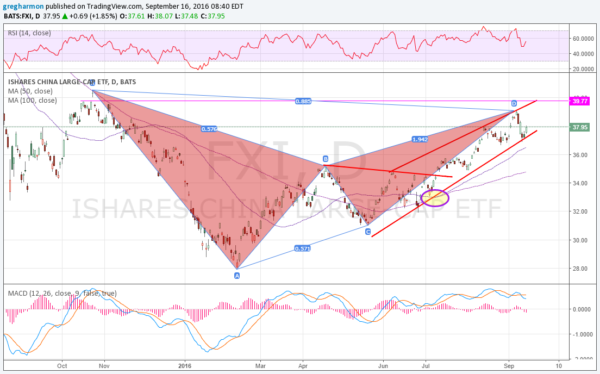
The Chinese Stock market is on its mid-Autumn Festival Holiday and that pause gives a chance to review and analyze the last few months of activity. And there is a lot of good to see there. After making a low in February, the Chinese large Cap ETF (NYSE:FXI) bounced to a high in April, retracing over 50% of the last leg lower. But then it floundered for 3 months.
The chart below shows that bounce and then a series of lower highs against a falling trend resistance through to the beginning of July. But something happened at the start of July that changed the perspective. First, the chart shows a Golden Cross printed. This is the 50-day SMA crossing up through the 200-day SMA. It shows accelerating short-term momentum, a bullish signal, especially when the price is above both SMA’s.

That led to the price action morphing into a rising channel, where it still sits. The full price activity since last October traced out a bearish Bat harmonic that reached its Potential Reversal Zone (PRZ) last week. It did reverse but only to the bottom of the channel where it bounced. The move higher Thursday off of the bottom of the rising channel suggests there may be another trip to the top rail. A quick move would find it around 40, a nice round number. This would also be a retest of the October-to-November top. Using the channel bottom as a stop gives a return of nearly 6% to that target and a reward-to-risk ratio of 3.75:1 using the pre-market price of 37.75 as an entry.
