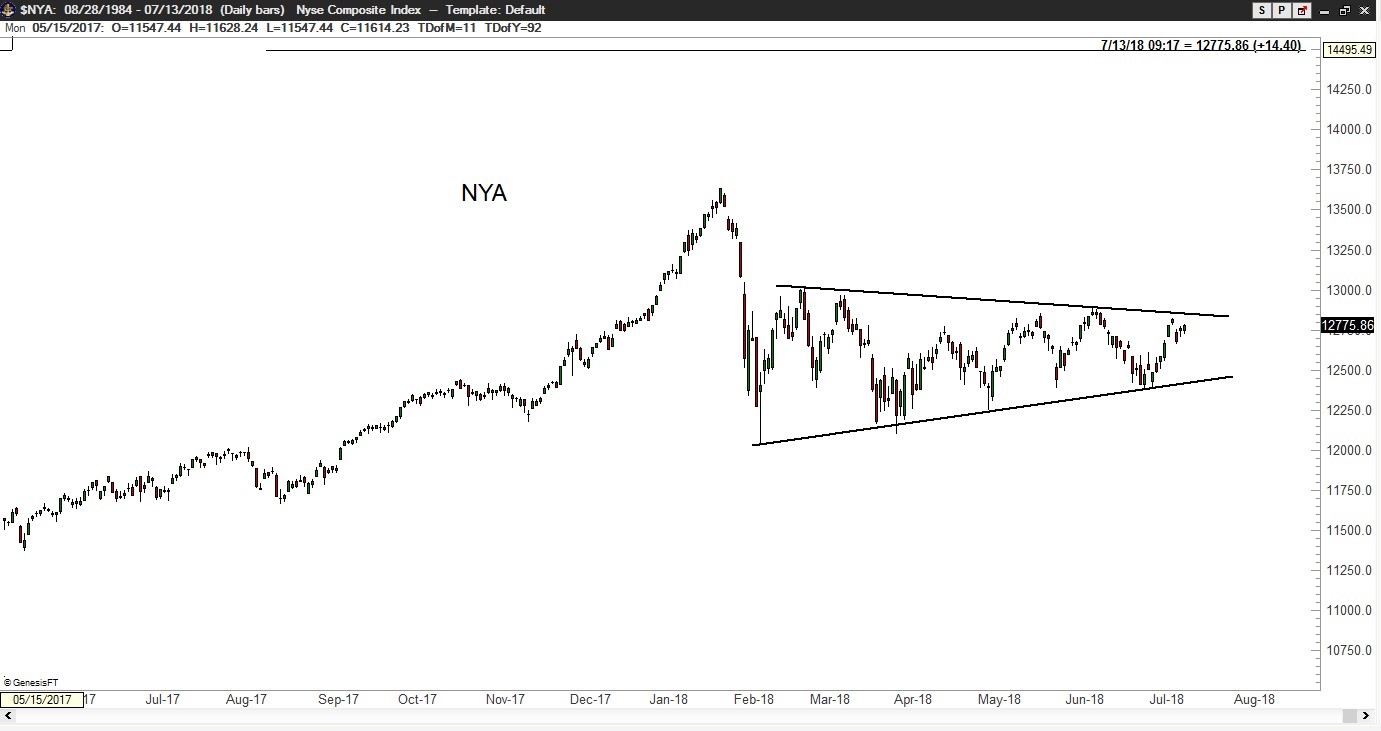
NYSE Composite
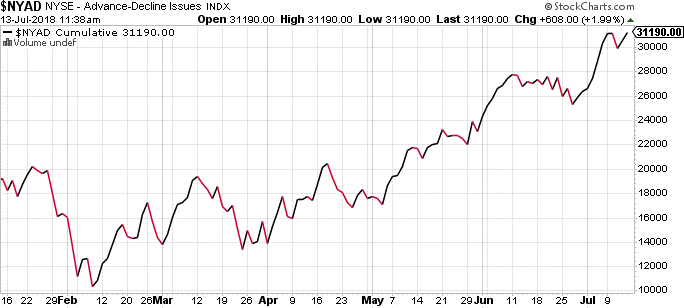
NYA displays a possible 6+ month symmetrical triangle. In my opinion the single most important chart for the U.S. stock market is the NYA cumulative A/D line. This chart indicates that the advance in U.S. equities represents strong market breadth and health.


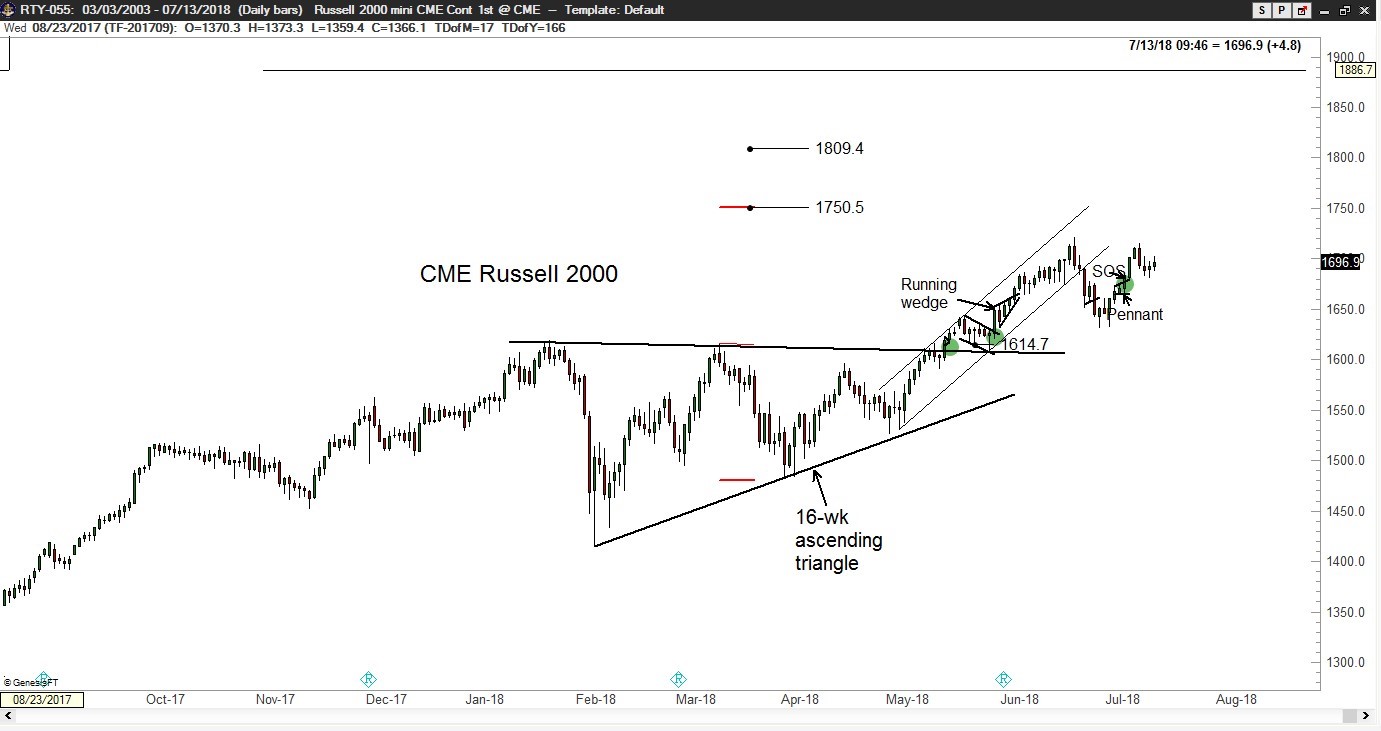
Russell 2000
Several chart observations are worthy of note.
- The advance on May 16 completed a 16-week ascending triangle with targets of 1750 and 1809.
- The decline from Jun 21 to Jun 28 appears to have been a shallow retest of the ascending triangle.
- The advance on Jul 5 could have been a “sign-of-strength” (SOS) that the major trend is reasserting

