In my days writing for TheStreet.com, the fiercest controversy raged whenever there was disagreement over whether to use technical or fundamental analysis. For simplicity, let’s call the protagonists “technicians” and “fundamentalists.”
The technicians can find successes from charts which apparently revealed moves totally unexpected by the fundamentalists. The fundamentalists describe chart reading as subjective and undependable. If you search for this question you will get 16 million results.
With fear and trepidation, I suggest – for discussion – my own conclusions on this topic. Some are just ideas, but there is one important item on which I feel quite strongly.
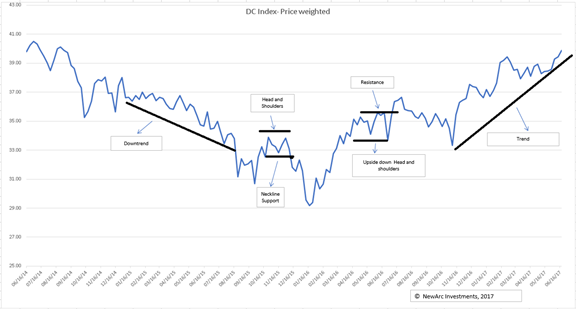
But first – please consider this chart. Is it bullish? Do you agree with the annotations by the analyst whom I consulted?

Please give this a little thought before reading on.
The Fundamentalist Side
There are many possible candidates, but I recommend this post on Why technical analysis is shunned by professionals. Andreas F. Clenow covers many aspects of this argument, but this early discussion of just how to define technical analysis sets the tone:
There is no definition. Anyone can make up anything and call it technical analysis. The field now seem to encompass everything from drawing trend lines to astrology.
Technical analysis started out with quite simple concepts, which are not all that dumb. In the early days, it was about looking for directional trends in prices and divergences between related market indexes. Experience told traders that when prices start moving in one direction, they are more likely to continue than to reverse. Technical analysis was just a way to visualize this concept.
He illustrates with this chart:

The Technician Side
Once again, there are many advocates. I like the explanation from Michael Kahn, writing at Forbes.
Critics will point out that forecasting future price movement based on past price movement is akin to reading tea leaves or divining the future from the textures of chicken entrails. Many of the high priests of fundamental analysis are quick to call technical analysis the financial world’s alchemy. Indeed, chart watchers cannot predict the future any better than your broker, your spouse or a Ouija board.
But what they can do better than most is make a decision about what to do–buy, sell or hold–based on the probabilities of the actions of others given certain conditions. In other words, if a pattern on the chart appears, a chart watcher can create a framework for what the market might do if and when prices break free from that pattern. It does not work every time, but past performance does give us an idea of what will happen so we can do something about it.
Who is right?
Although my own analysis is primarily fundamental, I look at a chart before any trade. My interpretation is rather like what we hear from the Dean of NYSE floor trading, Art Cashin. He regularly cites support and resistance levels, noting what is likely to happen if these are breached. He is an excellent source of trader thinking.
Using my own experience, I know that market psychology depends heavily on the original basis. An investor who is losing on a trade has buyer’s remorse. “If only the stock would get back to where I bought it….” This is probably the wrong time to sell, but it is how people think. Whenever I see a long period of trading at a price level, I know it was a battleground with many buyers and sellers.
I also know that we should respect trends, perhaps the most successful trading strategy. Is there more?
A Questionable Application of Technical Analysis
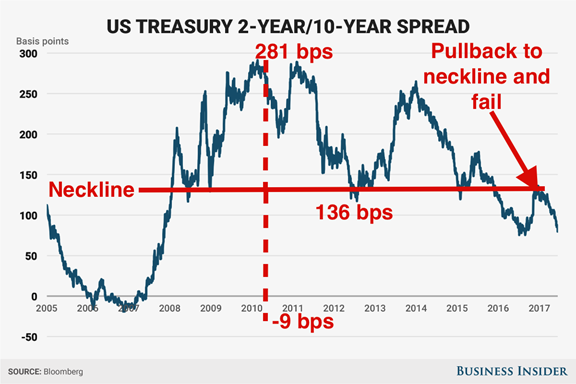
The limits of technical analysis is a topic that has been on my agenda for a long time. A recent popular post (over 33,000 page views) pushed it to the top. Jonathan Garber, writing at Business Insider, asserts that “A key predictor of the health of the American economy is inching closer to signaling a recession.”
This would be fair enough, although my own weekly update of the very best recession forecasters goes beyond the yield curve – and explains why. What troubled me was his use of technical analysis to predict future yield curve moves. Here is the chart:

There is no pure index representing this spread. With the short end not moving much, bond traders are more likely to be trading the ten-year note. They are a small segment of that market. This chart is not a meaningful forecast for the yield curve.
My Conclusions on Technical Analysis
As I noted above, technical analysis is fine in determining support and resistance. It is good at identifying trends. There are some other chart patterns that are widely followed, and may well be tradable. My weekly Stock Exchange emphasizes technical choices, as well as highlighting the debate.
But what about indicators and charts that no one is even trading?
There is no battleground. There is no complex head and shoulders pattern, because no one is looking at that chart or trading on it. If ever there was a case for the relevance of technical analysis, can it work in a market that doesn’t exist? Where there are no traders. I have seen it applied to sentiment indicators, or diffusion indexes – with no market for any of them. This is absolutely nonsensical.
We are all familiar with the philosophical question of whether a tree falling in a forest makes a sound, when no one is there to hear it. This is more like hearing a sound when there is no tree!
And finally, returning to our bullish chart for your consideration, it is a price-weighted index of companies with headquarters in my home county, DuPage. The stocks exist, but the index does not. No one is trading it. Would you bet your money on psychology when there are no traders?
