This week, Marc Faber (aka Dr. Doom) stated on CNBC:
I don’t think the market is as overbought as it was in ’87, so I don’t expect a crash. But I think for the time being, the market has peaked out, and I think in the meantime, bonds, which are extremely oversold, could rebound.
No one has a crystal ball – and market dynamics do not work in completely predicable patterns. I do worry that the risk from Europe effecting the economy is not quantifiable. Looking at historical relationships, one would conclude that Europe would only be a headwind to the USA Wall Street economy (aka GDP) via lower exports, and would have little effect on Main Street. Export sector is a disproportionally small employer.
Yet, what is going on in Europe is a continuation of the unresolved global financial crisis where there is no historical precedent. Many economic forecasts use the market as a forward indicator, and though I believe this is a dangerous game to play (as the market has no vision to the effects of a European triggered financial crisis) – it seems the market has a better imperfect record of forecasting than economists.
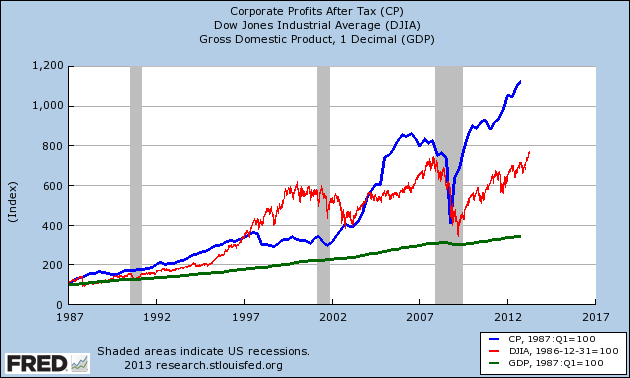
Pundits and analysts have several good means to gauge the health of the market. My test is using published corporate profits – even though this is a lagging indicator, and you must extrapolate existing rates of growth into the future. The following are corporate profits, Dow Jones Industrial Average and GDP graphics using several index dates.
Indexed on 1987
Indexed on 1995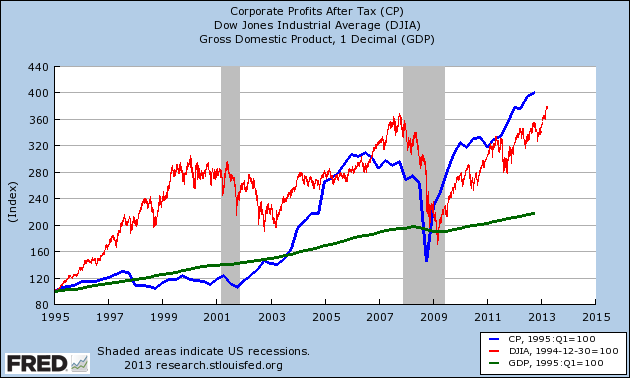
Indexed on 2000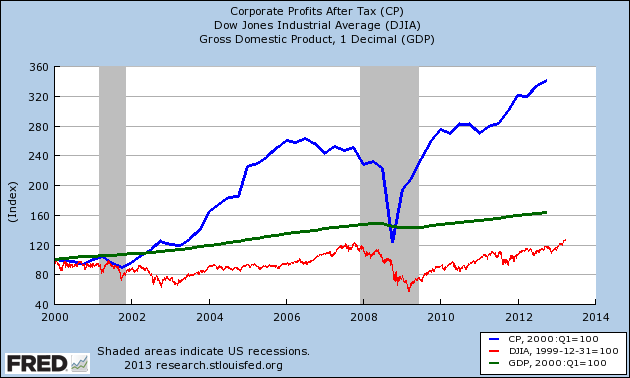
Indexed on 2005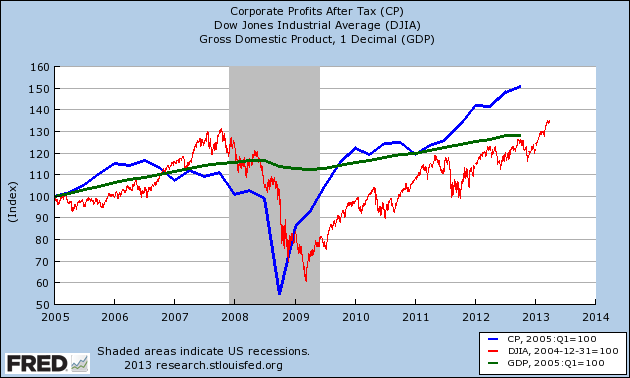
Indexed on 2010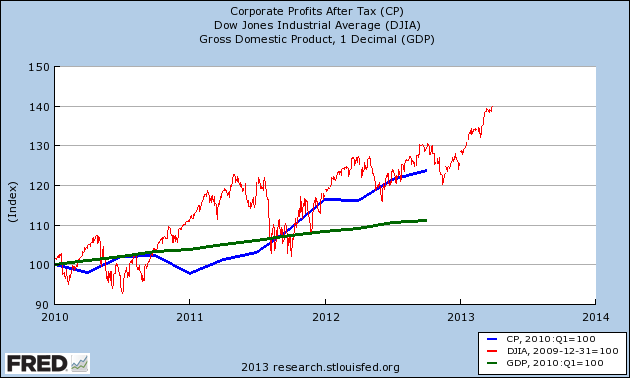
It is the above graph indexed on 2010 that leads one to believe the market has outrun its profit potential by approximately 10% – if one wants to use profit as a gauge. On the other hand, if you view longer periods (such as indexing since 2005) – the market is just catching up to the over-correction during the Great Recession. I tend to believe the later. In all events, using a single analytical method to gauge the market is dangerous.
Whatever the case, the concern at this moment should be Europe – and its chaotic and delusional approach to banking which only ensures that southern Europe goes into financial arrest. It is contagion which is not quantifiable, and that is real the risk for a significant market correction. On the other hand, it also would not surprise that a European banking crisis would cause massive monetary inflows into the USA which would be a positive dynamic for the USA economy and markets.
Other Economic News this Week:
The Econintersect economic forecast for April 2013 improved marginally, and is now in a zone which says the economy is beginning to grow normally. There are some warning signs that our interpretation is not correct – but we will see how these play out in the coming months. Not to end on a negative note, the majority of pulse points are improving.
The ECRI WLI growth index value has been weakly in positive territory for over four months – but in a noticeable improvement trend. The index is indicating the economy six month from today will be slightly better than it is today.
Current ECRI WLI Growth Index 
Initial unemployment claims rose from 357,000 (reported last week) to 385,000 this week. Historically, claims exceeding 400,000 per week usually occur when employment gains are less than the workforce growth, resulting in an increasing unemployment rate (background here and here).
The real gauge – the 4 week moving average – also worsened from 343,000 (reported last week) to 354,250. Because of the noise (week-to-week movements from abnormal events AND the backward revisions to previous weeks releases), the 4-week average remains the reliable gauge.
Weekly Initial Unemployment Claims – 4 Week Average – Seasonally Adjusted – 2011 (red line), 2012 (green line), 2013 (blue line)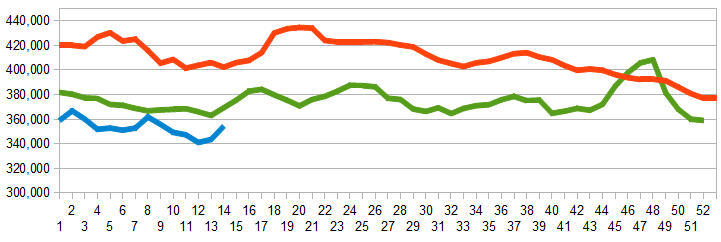
Bankruptcies this Week: GMX Resources, PolyMedix, Pac-West Telecomm
Data released this week which contained economically intuitive components(forward looking) were:
- Rail movements which are mixed.
- the market reacted to several disappointing data points this week – but there was no smoking gun of bad data which indicates slowing economic growth. Jobs are a lagging indicator (we believe a lag of six months)
Weekly Economic Release Scorecard:
Click here to view the scorecard table below with active hyperlinks

