Investing.com’s stocks of the week
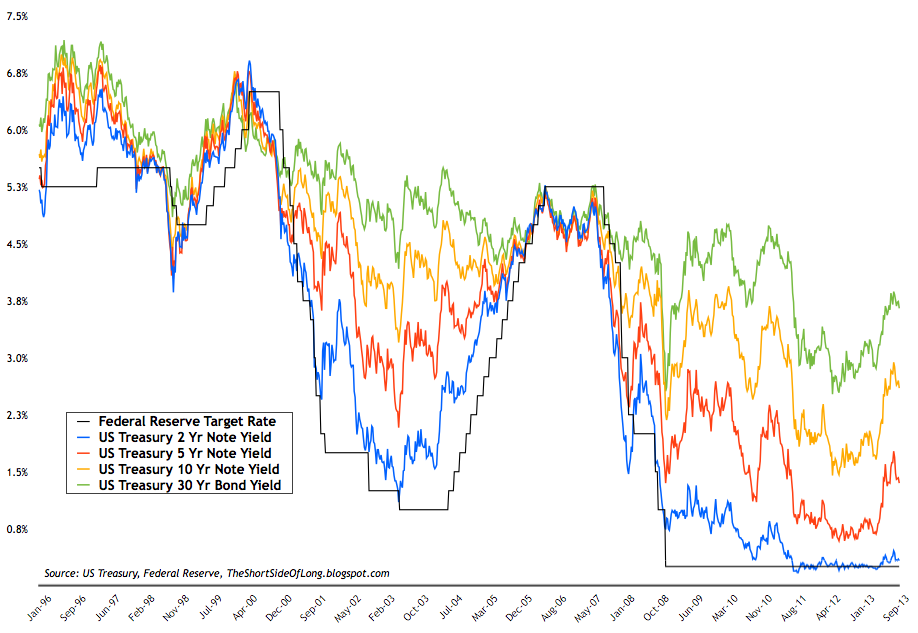
Interest rates in the bond market have risen sharply since April of this year. US Treasury 10 Year Note yield rose from 1.614% in late April 2013 towards an intermediate peak of 2.984% in late August. The rates almost doubled in a short period of time.
The move was even more dramatic in the 5 Year maturity, where yields rose from 0.65% in late April of this year, towards 1.85% into late August. Here, we had tripling in the interest US Treasury pays on its outstanding debt. For further reference, glance at the chart below.
Chart 1: Interest rates on various US Treasury Note maturities
So what is next for interest rates?
It is difficult to answer that question without a crystal ball. Having said that, in coming years, interest rates will most likely have a rising tendency. Let me explain very quickly: after a 32 year decline in rates, we could see a rising trend in coming decades, similar to the 1949 to 1981 trend (for further information, open up a history book).
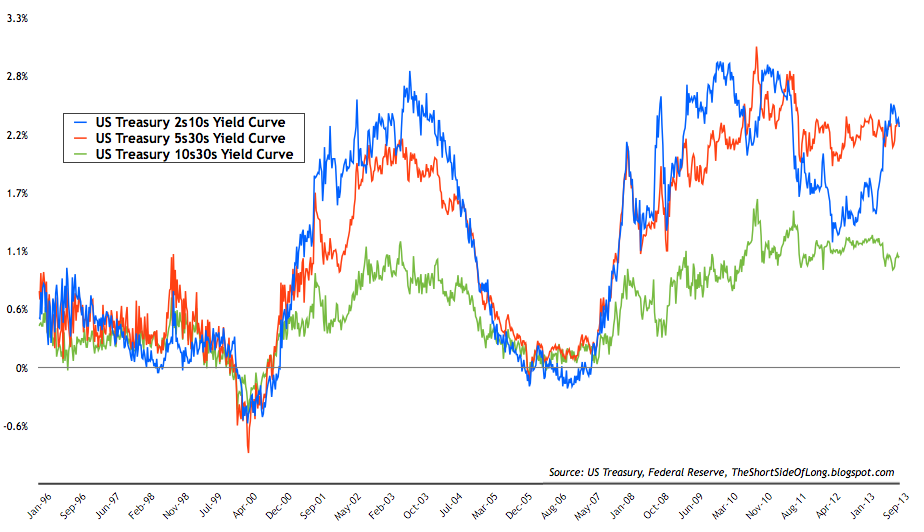
Chart 2: 2s10s US Treasury yield curve is close to reaching upper extremes
Now, let us look at Chart 2 above. What is interesting about this, is the fact that the Fed has basically locked the 2 Year Note, which means for the yield curve to steepen or flatten, it all comes down to the 10 Year Note's movement.
The 2s10s yield curve shows that we have reached previous extreme levels of steepening - at about 2.5% differential in the spread. Therefore, it is going to be difficult to see the yield curve steepen too much further, assuming that the 2 Year Note stays locked.
Traders could see this clue as a signal that the current rise in long term rates (sell off in the bond market) is pretty much done for now. Assuming this is close to correct, in the short term, we could expect some mean reversion and flattening of the yield curve.
