Weekly MOF data shows Japanese investors have been sellers of foreign bonds in 11 out of the 15 weeks reported so far this year. The total outflow from foreign bonds year to date has been -$53.5 bln, not an insignificant amount. And it’s not just foreign bonds. Japanese investors have sold foreign equities in 11 out of 15 weeks this year too, but the total outflows (-$7.6 bln) are of a smaller magnitude. Given these MOF readings, we thought it would be interesting to look at recent trends in Uridashi bond issuance. As always, we net out JPY-denominated issues in order to focus on the foreign currency aspects of the Uridashi market.
Not surprisingly, Uridashi issuance has not really picked up from 2013. Foreign currency-denominated issuance peaked around $25 bln in 2010 before falling three straight years to $16 bln in 2013, which was the lowest annual total since 2007. So far in 2014, we are on a $15.8 bln annualized pace of non-JPY issuance for the entire year.
Marketed to retail investors, Uridashi bonds represent a small slice of the FX market. Still, we believe that the observed trends in this segment can reflect those of the larger Japan investment community as well. Given near-zero rates in much of the DM and relatively high (and in some cases rising) interest rates still in EM, we think that the Japanese flows into EM should continue in the coming months, albeit at a modest pace.
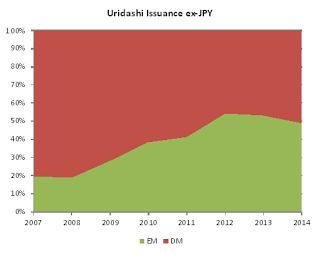
The share of EM-denominated Uridashi bonds increased steadily from less than 10% in 2006 to nearly 55% in both 2012 and 2013. So far in 2014, that EM share has fallen under 50%. If sustained, this would be the first sub-50% reading since 2011. It is clear that this past growth in EM Uridashi issuance really came at the expense of DM stalwarts AUD and NZD.
The share of these two currencies of total non-JPY Uridashi issuance was nearly 75% in 2008, but fell steadily to 30% in 2013. This share has rebounded to nearly 40% so far in 2014, helped in part by the start of the RBNZ tightening cycle as well as expectations that the next RBA move will be a hike, not a cut.
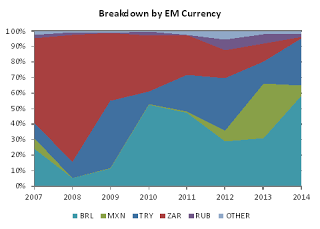
The BRL share of total EM Uridashi issuance rose to 31% in 2013 from 29% in 2012. Its average share from 2007-2013 was 29%, peaking at over 50% in 2010. BRL has increased its share sharply so far in 2014 to nearly 60% of total EM issuance. As Brazil local rates have headed higher in the fight against inflation, BRL has regained its prior attractiveness. Policymakers have also worked to repair the damage to investor sentiment.
The MXN share of total EM Uridashi issuance rose to 35% in 2013 from 7% in 2012 and only 1% in 2011. Its average share from 2007-2013 was 7%. Banco de Mexico’s easing cycle over the course 2013 has lessened the peso’s yield advantage, and so the MXN share has fallen to only 6% so far this year. Fundamentals remain strong, but the peso will likely have trouble gaining traction if risks of Banco de Mexico rate cut pick up this year due to softness in the economy.
The TRY share of total EM Uridashi issuance was 15% in 2013, down sharply from nearly 35% in 2012. Its average share from 2007-2013 was 21%. The TRY share has, surprisingly, rebounded nicely to 30% so far this year in the wake of the emergency January rate hike. Still, TRY faces strong headwinds stemming from heightened political risk. Relatively high rates could help support the lira until fundamentals improve, but Prime Minister Erdogan is already trying to strong-arm the central bank into cutting rates.
The ZAR share of total EM Uridashi issuance fell to 12% in 2013, down from nearly 20% in 2012 and the lowest in recent years. Its average share from 2007-2013 was nearly 40%. So far in 2014, the ZAR share is 1%. SARB has started a tightening cycle and while this should improve the rand's yield advantage, the poor fundamental outlook could prelude much demand for ZAR-denominated issuance in 2014. Rates are still near historically low levels, and we add in ongoing social turmoil, a very weak fundamental outlook, and high risk of credit downgrades. We believe this shift away from the rand is well-deserved, but acknowledge it could benefit from further SARB tightening.
The increasing RUB share of total EM Uridashi issuance appears to have stalled. In 2013, the RUB share was 6% vs. 7% in 2012. Its average share from 2007-2013 was 3%. However, the ruble share has fallen to less than 2% so far in 2014. The ruble should be underpinned by relatively high oil prices and the central bank’s rate hike back in March, but uncertainty surrounding the Ukraine crisis has likely hurt the ruble’s attractiveness. More tightening may be seen, but may not be enough to offset the ongoing political risks.
Taken together, these five EM currencies make up 98% of the EM Uridashi issuance so far in 2014. From 2007-2013, these five have never accounted for less than 95% of the total EM Uridashi issuance, and are typically more in the 98-99% range.
One notable development in 2014 so far is a sizable issue from Hungary, which puts the HUF share of total EM issuance near 2% this year. This puts it ahead of ZAR and virtually even with RUB.
Clearly, high yielding ZAR is no longer as attractive as it once was due to deteriorating fundamentals. On the other hand, TRY has seen its popularity rebound this year despite ongoing political uncertainty. Brazil has tightened aggressively and has seen demand for BRL-denominated Uridashi bonds return. Strangely, INR and IDR have not seen much of a boost in demand despite aggressive tightening by both RBI and BI last year. Both had a 1% share of total EM Uridashi issuance in 2013, but have fallen to negligible amounts so far in 2014.
(from my colleagues Dr. Win Thin and Ilan Solot)


