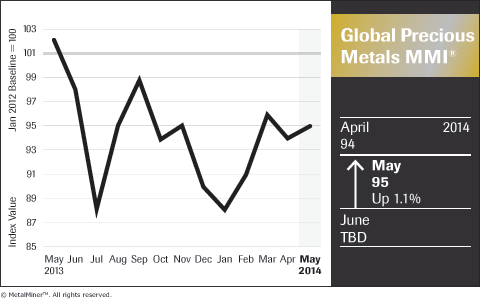
Due mainly to strong Palladium price movement – thanks to Amplats, Lonmin, striking South African miners, Vladimir Putin, and Americans buying cars – MetalMiner’s monthly Global Precious Metals MMI® clocked in a value of 95 in May, an increase of 1.1 percent from 94 in April.
The US palladium bar price on our price index remained above the $800 per ounce benchmark that our lead forecasting analyst, Raul de Frutos, alluded to last month. South African miner strikes sure haven’t helped things, as they’ve bled into their 15th week. Amplats, Implats and Lonmin are now taking a different tack with worker negotiations, but a resolution doesn’t look severely imminent.
Sanctions on Russia amidst the ongoing Ukraine turmoil are affecting a number of precious markets; not only gold prices, but supply/demand expectations for palladium, as the country’s stockpiles play a role in price movements. According to ETF Securities, GFMS expects the palladium deficit to reach 1.3 million ounces in 2014 from a 1.0-million-ounce deficit last year.
To boot, US car sales continued to show healthy growth, rising 8 percent year-on-year in April – a good thing, unless you’re looking to spot-source palladium on the cheap.
What This Means for PGM Buyers
As Raul wrote in his latest palladium forecast: “We expect palladium to remain strong through the rest of 2014, likely trending higher. How high can palladium prices go in 2014? We don’t know – no one knows. However, we believe this is a good time to hedge your palladium purchases and take risk of the table.”
Better hedge before it’s too late!
Key Price Drivers
At $807.00 per ounce, US palladium bar finished the month up 4.3 percent. The price of Japanese palladium bar climbed 4.1 percent to $25.73 per gram. The price of Chinese palladium bar increased 2.8 percent to $28.92 per gram. Chinese Gold bullion gained 1.8 percent to finish the month at $41.63 per gram. After a 1.7 percent increase, Indian gold bullion finished the month at $467.17 per 10 grams. At $45.83, Japanese Platinum bar finished the month up 1.2 percent per gram. Chinese platinum bar prices inched up 1.0 percent to $48.73 per gram. US gold bullion rose 0.5 percent to $1,291 per ounce. US platinum bar shifted up 0.5 percent last month to settle at $1,420 per ounce.
Japanese Silver prices dropped by 3.4 percent this month to $6.14 per 10 grams. Following a 3.1 percent decline in price, US silver finished the month at $19.14 per ounce. The price of Indian silver drifted 1.4 percent lower to $723.11 per kilogram. Japanese gold bullion prices decreased by 0.6 percent this month, ending at $41.44 per gram. The value of Chinese silver weakened by 0.2 percent this month, settling at $654.25 per kilogram.
The Global Precious Metals MMI® collects and weights 14 global precious metal price points to provide a unique view into precious metal price trends over a 30-day period. For more information on the Global Precious Metals MMI®, how it’s calculated or how your company can use the index, please drop us a note at: info (at) agmetalminer (dot) com.
by Taras Berezowsky

