There have been many theories explaining the recent fall in prices. However, one more factor, which may have impacted the fall is the Gap Filling theory.
Silver Prices, previously in the month of August 2013, shot up due to some macro economic factors or call it short squeezing from the 19.26 levels before filling the gap at 18.82, which existed when silver prices moved sharply above 20 levels from its 52-week low 18.18, which was much awaited and that has been filled for now suggests the Price Action. In the long run, the Bullish Trend established by XAG/USD in August by making a high above 24 levels, which is still active. On the other side, Silver has a gap to be filled between 28 - 28.86 levels after its steep drop in prices from 31.86 levels in 2013 January, which squares 28.86 levels based on Fibonacci Golden Ratio.
Technical:

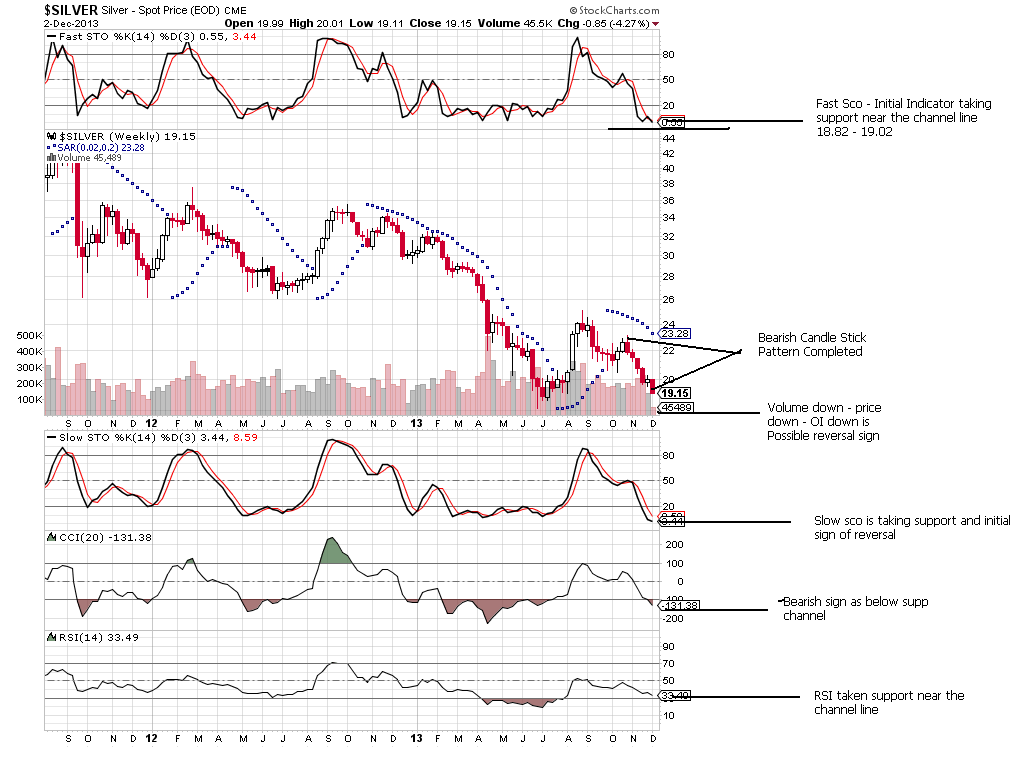
Fast Stochastics (Fast Sco) also known as Initial Indicator is taking support near the bottom line or channel which has been plotted as levels between 18.82 - 19.02. Candle Stick Pattern has completed its bearish course which also indicates a reversal in place.
The other major indicators Slow Stochastics (Slow Sco) & Relative Strength Index (RSI) have already taken support near the bottom channel line as highlighted in the chart. The Commodity Channel Index (CCI) another major indicator has cracked the support but as a majority of indicators suggesting reversal , CCI may change its direction anytime.
Open interest down, volume down, and prices down is also an indication of a trend reversal in place.
Fundamental Demand & Supply
India's silver imports rose to a three-month peak in October and are on track to hit a record this year. This is proven by data from Thomson Reuters GFMS as buyers opt for the precious metal instead of expensive gold to meet high seasonal demand. More shipments by the world's top buyer may help underpin global silver prices that have slumped 37 percent so far this year - their biggest annual drop in at least three decades. Silver imports jumped 40 percent to 338 tonnes in October from 241 tonnes in September, GFMS data showed, driven by demand during the festivals and wedding's season that starts from October and tapers off by early May next year.
In the Short term, I expect silver prices to reach 27.86 - 28.86 Levels in the year 2014.
Traders to get a clear understanding about tape ill add some points from my Previous Article published on 17th May 2013.
Time To Opt Out Of Shorts?
I have been a pretty consistent bear on Gold and Silver since the April 2011 top. In fact, I called the absolute topat 44.15, initiated sell for target 22.15 - I have been a nemesis and the destination of hate of Silver & Gold bulls since and throughout, we never initiated a buy for momentum trade rather we always initiated Sell Calls & Sell on Rises. Strongly Down The chart structure in the metals Gold, Silver and Platinum all remain negative. Major chart tops have been completed, trends are strongly down, and no signs of a bottom have appeared. Additionally, lower chart targets exist. However, I am tempering my view of Silver substantially. I am NOT a bull. However, I can no longer be a bear.
Trading Levels Short Term (1-3 months)
Best buy and support between 18.82 - 19.08, while momentum upside is capped at 21 - 22.48 for now. In near term 1 - 4 week time frame silver has potential to test 23.90 - 24.05, while in the short term (1-3 months) target is capped at 27.88 - 28.86. Strict Stops should be maintained at 17.96 as below 17.25 will put bulls in an ugly situation as prices can drop till 15.50 - 13.86
