The top two cryptocurrencies by market capitalization have regained lost ground after posting significant losses last week. Still, several indicators suggest the worst is yet to come.
Key Takeaways
- Bitcoin is up more than 10% since Nov. 11, but now the TD sequential indicator is flashing sell signals.
- Likewise, Ethereum recovered despite the mounting sell pressure behind it.
- Both BTC and ETH whales have been significantly reducing their positions over the past few weeks, suggesting further losses on the horizon.
Bitcoin and Ethereum ended the weekend with a bang. Despite the bullish move, pushing the tokens up more than 4%, on-chain data reveals that large investors have been offloading their tokens at every upswing.
Whales Block Bitcoin at Every Turn
While retail investors remain overwhelmingly bullish about Bitcoin’s price action, whales have been taking every opportunity to realize profits.
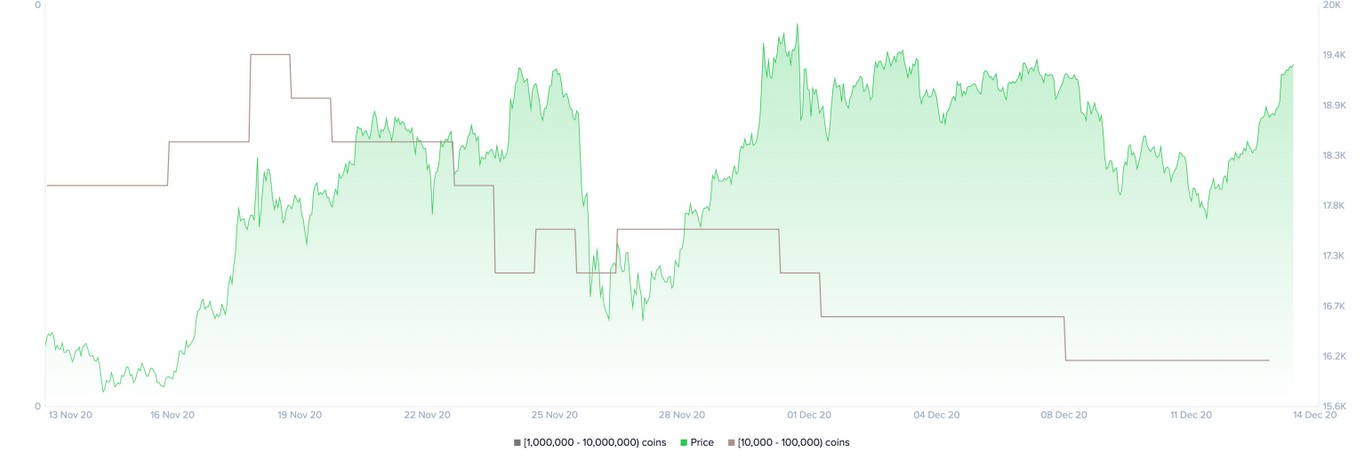
On-chain data from Santiment reveals that the number of addresses holding 10,000 to 100,000 BTC has significantly dropped in the past month. Since Nov. 18, roughly seven whales have left the network or redistributed their tokens, representing a 6.2% decline over a short period.
The mounting selling pressure behind the flagship cryptocurrency may seem insignificant at first glance.
Still, when considering these large investors hold between $19 million and $1.9 billion in BTC, the spike in sell orders can translate into billions of dollars.
From a technical perspective, Bitcoin also looks bearish regardless of the high volatility that the cryptocurrency market is going through.
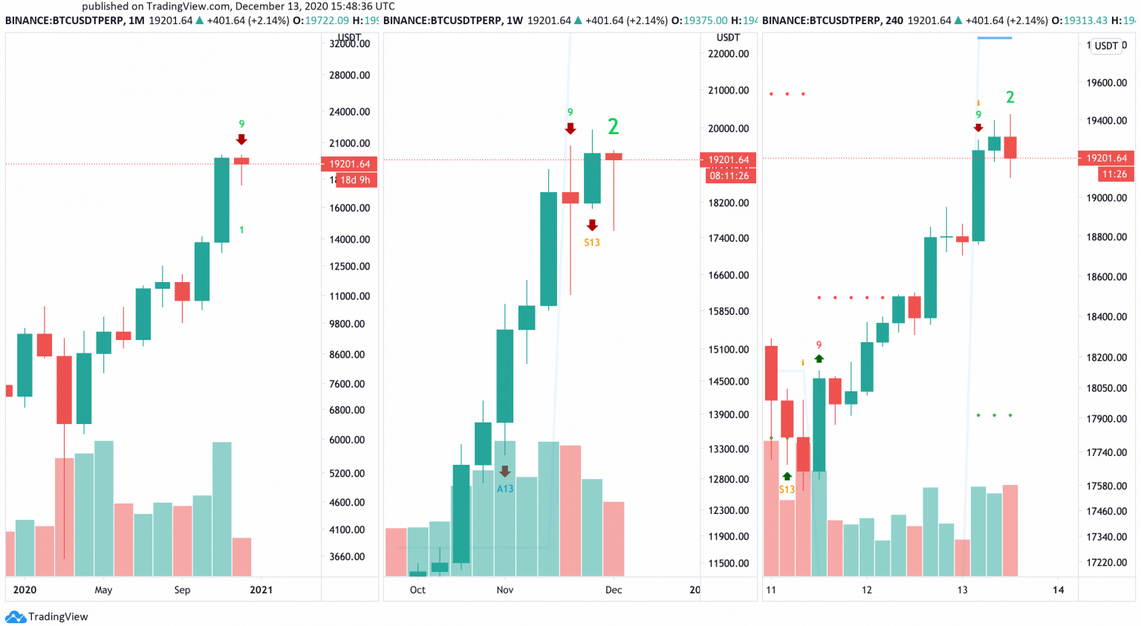
The TD sequential presented sell signals across the board, suggesting that BTC sits in overbought territory. The bearish formations developed in the form of green nine candlesticks on the 1-month, 1-week, and 4-hour chart, forecasting a one to four monthly candlesticks correction.
Such market behavior indicates that the partial price recovery seen on Dec. 13 will likely lead to further losses.
Nevertheless, IntoTheBlock’s “Global In/Out of the Money” (GIOM) model reveals that Bitcoin sits on top of a massive demand wall that could prevent it from a steeper decline.
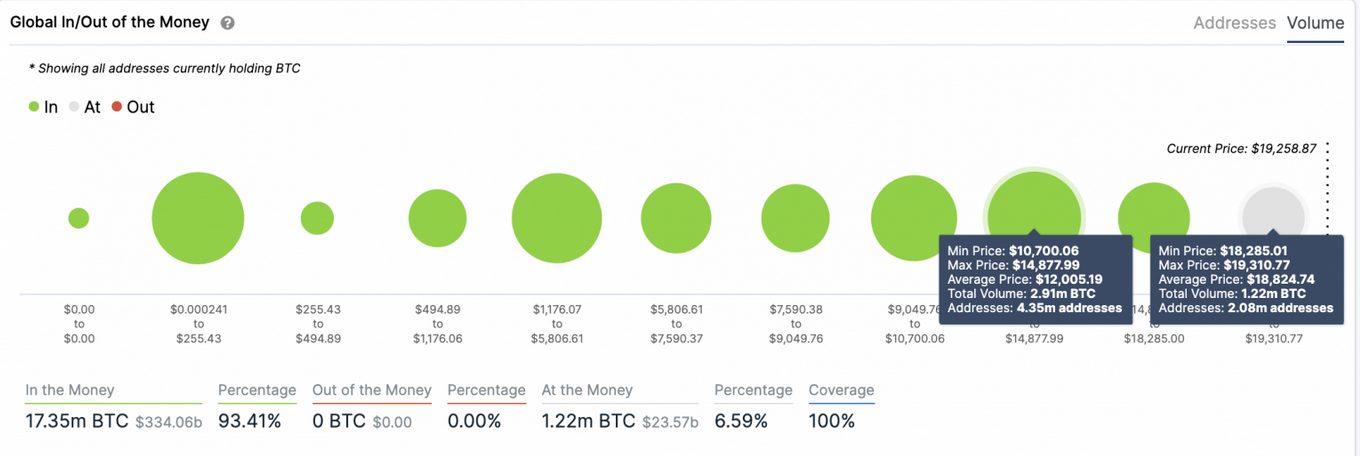
Based on this on-chain metric, more than 2 million addresses had previously purchased over 1.20 million BTC between $18,300 and $19,300.
Only a candlestick close below the $18,300 support level will help validate the pessimistic outlook.
If this were to happen, the bellwether cryptocurrency would likely drop to look for support around the nearest interest area that sits between $10,700 and $14,900.
Given the lack of any supply barriers ahead, there a slight chance that Bitcoin will be able to shrug off all the sell signals and continue rising towards new all-time highs.
Investors must watch out for a candlestick close above the recent high of $19,915 as it will invalidate the pessimistic outlook and result in an upswing towards $24,000 or higher.
Ethereum Holders Sell the News
The launch of the Beacon Chain appears to have served as a “sell the news” event for Ethereum holders.
Although market participants continue staking their ETH, the network’s activity has been drastically declining.
The number of on-chain transactions greater than $100,000 plummeted by 55%, while the number of new addresses joining the network dropped by 47%.
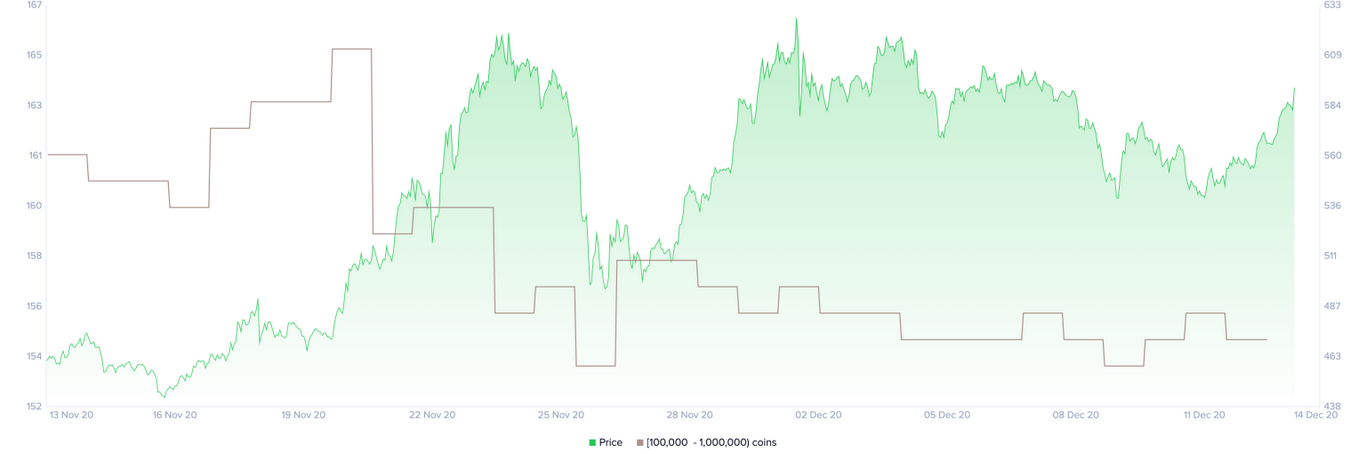
The downward trend in network activity is a concerning sign for ETH’s near-term price action when considering that some whales have been offloading their coins over the past few weeks. Santiment’s holder distribution chart shows that the number of addresses holding 100,000 to 1 million Ether has dropped by 6.60% since Nov. 20.
While selling pressure rises, the TD sequential indicator forecasts that the smart contracts token is bound for a steep decline. This technical index presented sell signals in the form of green nine candlesticks on ETH’s 1-week and 1-month chart.
The bearish formations suggest that a further increase in sell orders around the current price levels could take ETH on a wild downward ride.
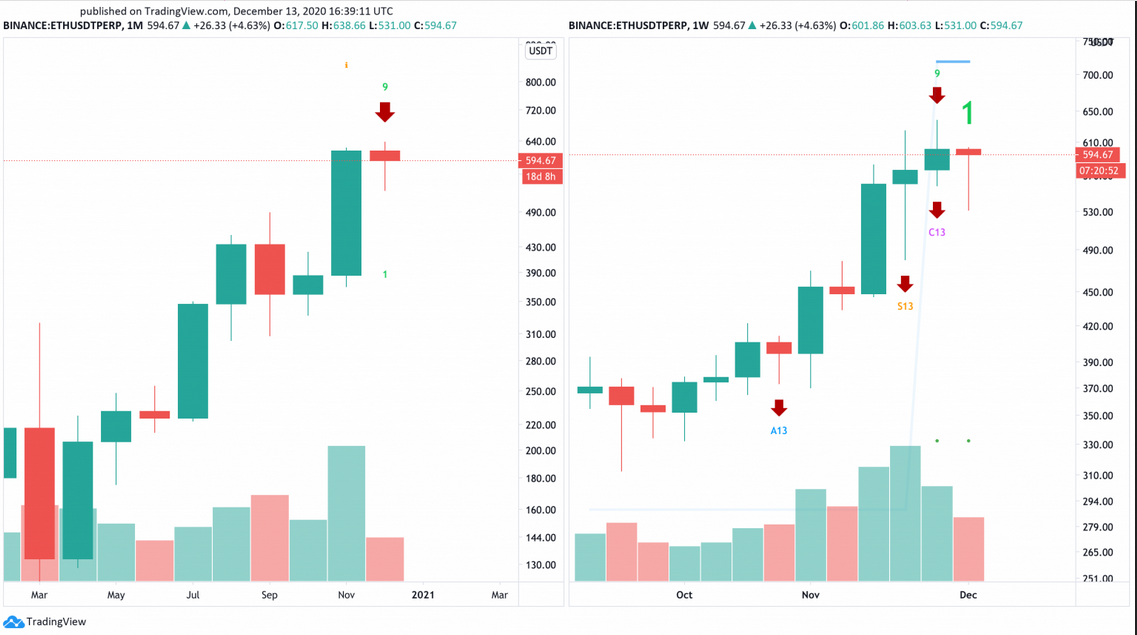
IntoTheBlock’s GIOM model suggests that the $565 support level is critical for Ethereum’s trend.
Based on the high demand around this price hurdle, only a candlestick close below this level will validate the pessimistic outlook. If this were to happen, the second-largest cryptocurrency by market capitalization could plummet and look for support around the $450 or $320 level.

Conversely, the only significant supply barrier ahead of Ethereum sits around $620. Turning this resistance wall into support will jeopardize the bearish outlook and push this altcoin to new yearly highs.
On its way up, Ether could target $720 and even $800 if the buying pressure behind it is significant enough.
Uncertainty Dominates Bitcoin, Ethereum
While institutional investors have made it clear that they intend to continue adding cryptocurrencies to their balance sheets, Bitcoin and Ethereum’s near-term future remains uncertain.
Both cryptocurrencies have flashed sell signals on their monthly charts, according to TD setup. Meanwhile, the Crypto Fear and Greed Index is hovering at a record high, sensing “extreme greed” among market participants.
These bearish signs are too significant to ignore regardless of the optimism in the cryptocurrency market.
If the spike in selling pressure seen during the week of Dec. 7 intensifies, Bitcoin might be poised to lose $18,300 as support and aim for $14,000. Ethereum, on the other hand, will have to break below the $565 hurdle to drop towards $400.
Failing to do so by climbing above their respective peaks will signal the correction’s end and lead to higher highs.
