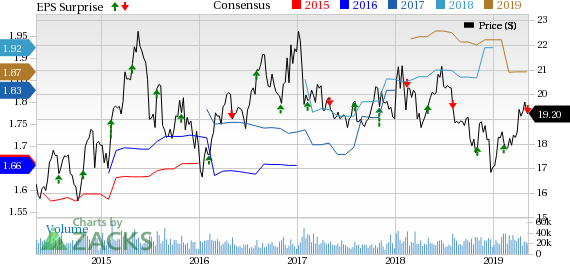
The Western Union Company (NYSE:WU) reported first-quarter 2019 operating earnings of 39 cents per share, missing the Zacks Consensus Estimate by 7.14%. The same was down 13.3% year over year.
Earnings were hurt by lower revenues, and higher expenses and effective tax rate.
Behind the Headlines
Total revenues of nearly $1.3 billion missed the Zacks Consensus Estimate by 3.7% and declined 4% on a year-over-year basis but were up 2% on a constant-currency basis. Weakening of Argentine Peso led to a decline in revenues, which was partly offset by positive effects of inflation in the company’s Argentina-based business.
Total operating expense of $1.09 billion was down 3% year over year due to a decline in cost of services.
Total operating margin of 18.8% declined 30 basis points year over year.
The Western Union Company Price, Consensus and EPS Surprise
Segment Update
Consumer-to-Consumer (C2C)
Revenues of $1.06 billion declined 3% on a reported basis but remained unchanged on a constant-currency basis. Total transactions grew 2%, driven by strength at westernunion.com.
Region-wise growth in U.S outbound business and sends originated in Latin America was offset by declines in U.S. domestic money transfer and sends originated in the Middle East and Asia Pacific. Operating income of $233.3 million declined 3% year over year.
Revenues from westernunion.com C2C improved 17% on a reported basis and 19% on a constant-currency basis. Notably, westernunion.com represented 13% of total C2C revenues in the quarter under review.
Business Solutions
Revenues decreased 1% on a normal basis, but were up 4% on a constant-currency basis year over year to $95.6 million, driven by growth in Asia Pacific and Europe.
The segment reported operating income of $8.6 million, compared with $2.8 million in the year-ago quarter.
Other
Other segment primarily consists of the U.S. and Argentina bill payments businesses. Revenues slipped 9% to $184.5 million.
Operating income declined 55% to $9.3 million and operating margin contracted 510 bps to 9.3%, both on a year-over-year basis.
Balance Sheet (As of Mar 31, 2019)
Cash and cash equivalents were $833.1 million, down 14% year over year.
Borrowings declined nearly 1.8% year over year to $3.4 billion.
Stockholders' equity was a deficit of $374.2 million, compared with stockholder’s equity deficit of $309.8 million at year-end 2018.
At the end of the quarter, the company generated net cash of $239.6 million from operations, up 80% year over year.
Share Repurchase & Dividend Update
In the reported quarter, the company returned $260 million in share buybacks and dividend payment to its shareholders.
Business Update
The company expects to sell its business Speedpay U.S. domestic bill payments for nearly $750 million this month. It has also successfully completed the sale of its Paymap mortgage payment services in May 2019.
These efforts reflect the company’s efforts to streamline operations by focusing more on core business area of cross-border, cross-currency money movement.
The company expects to utilize approximately $600 million in cash proceeds, available from the transactions for a combination of share repurchase and net debt reduction over the next 12 months.
The sale of these businesses will have the dilutive effect to the tune of 10 cents on 2019 and 2020 earnings per share.
2019 Guidance Update
The company expects revenue growth of low single-digit (on a constant currency basis), GAAP operating margin of approximately 20%, EPS in a range of $2.66 to $2.76 (versus $1.83 to $1.95) and cash flow from operating activities of approximately $950 million (versus $1 billion earlier).
Zacks Rank and Stocks to Consider
Western Union carries a Zacks Rank #3 (Hold). Some better-ranked stocks in the same space are FleetCor Technologies, Inc. (NYSE:FLT) , Worldpay, Inc. (NYSE:WP) and Green Dot Corporation (NYSE:GDOT) . Each of these stocks carries a Zacks Rank #2 (Buy) and have average four-quarter positive surprise of 1.71%, 5.2% and 17.4%, respectively. You can see the complete list of today’s Zacks #1 Rank (Strong Buy) stocks here.
Breakout Biotech Stocks with Triple-Digit Profit Potential
The biotech sector is projected to surge beyond $775 billion by 2024 as scientists develop treatments for thousands of diseases. They’re also finding ways to edit the human genome to literally erase our vulnerability to these diseases.
Zacks has just released Century of Biology: 7 Biotech Stocks to Buy Right Now to help investors profit from 7 stocks poised for outperformance. Our recent biotech recommendations have produced gains of +98%, +119% and +164% in as little as 1 month. The stocks in this report could perform even better.
See these 7 breakthrough stocks now>>
FleetCor Technologies, Inc. (FLT): Free Stock Analysis Report
Green Dot Corporation (GDOT): Free Stock Analysis Report
The Western Union Company (WU): Free Stock Analysis Report
Vantiv, Inc. (WP): Free Stock Analysis Report
Original post
Zacks Investment Research

