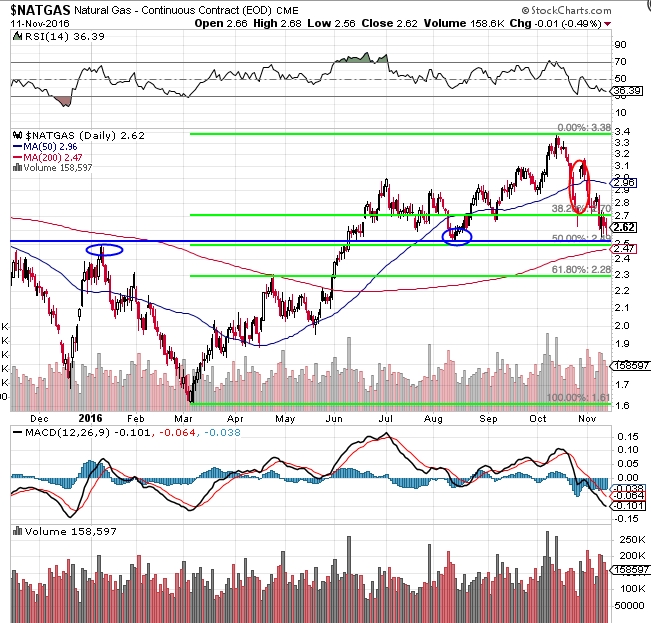
Natural gas has been falling uncontrollably after reaching a one-year high in October. The good news is that natural gas may be meeting resistance soon. The chart below shows that natural gas is in between the key levels of 38.2% and 50% of fibonacci retracement. It is likely that natural gas will meet resistance at around $2.50. The line in blue represents resistance formed by the peak of a prior trend and the trough of another. This line almost perfectly matches up with the 50% line of the fibonacci retracement. This indicates a high probability that natural gas prices will have a tough time breaking through that level of resistance. It is also noteworthy to mention the gap circled in red. Prices often move up to the range of the gap to ‘fill it up’. Although the time at which this happens is not certain, considering the resistance lines right below current prices, we can expect that the price will move up (assuming it does not break through resistance at $2.50).
- English (UK)
- English (India)
- English (Canada)
- English (Australia)
- English (South Africa)
- English (Philippines)
- English (Nigeria)
- Deutsch
- Español (España)
- Español (México)
- Français
- Italiano
- Nederlands
- Português (Portugal)
- Polski
- Português (Brasil)
- Русский
- Türkçe
- العربية
- Ελληνικά
- Svenska
- Suomi
- עברית
- 日本語
- 한국어
- 简体中文
- 繁體中文
- Bahasa Indonesia
- Bahasa Melayu
- ไทย
- Tiếng Việt
- हिंदी
Reversal For Natural Gas Likely
Published 11/11/2016, 09:41 PM
Updated 07/09/2023, 06:32 AM
Reversal For Natural Gas Likely
Latest comments
Loading next article…
Install Our App
Risk Disclosure: Trading in financial instruments and/or cryptocurrencies involves high risks including the risk of losing some, or all, of your investment amount, and may not be suitable for all investors. Prices of cryptocurrencies are extremely volatile and may be affected by external factors such as financial, regulatory or political events. Trading on margin increases the financial risks.
Before deciding to trade in financial instrument or cryptocurrencies you should be fully informed of the risks and costs associated with trading the financial markets, carefully consider your investment objectives, level of experience, and risk appetite, and seek professional advice where needed.
Fusion Media would like to remind you that the data contained in this website is not necessarily real-time nor accurate. The data and prices on the website are not necessarily provided by any market or exchange, but may be provided by market makers, and so prices may not be accurate and may differ from the actual price at any given market, meaning prices are indicative and not appropriate for trading purposes. Fusion Media and any provider of the data contained in this website will not accept liability for any loss or damage as a result of your trading, or your reliance on the information contained within this website.
It is prohibited to use, store, reproduce, display, modify, transmit or distribute the data contained in this website without the explicit prior written permission of Fusion Media and/or the data provider. All intellectual property rights are reserved by the providers and/or the exchange providing the data contained in this website.
Fusion Media may be compensated by the advertisers that appear on the website, based on your interaction with the advertisements or advertisers.
© 2007-2024 - Fusion Media Limited. All Rights Reserved.

