[Note to readers -- Whenever I actually enjoy some time off on a weekend, there is a challenge in posting the regular WTWA article. I could always do a simple indicator update, and I monitor many sources in real time. I also have a plan for my own trading for the week ahead. Finding the six hours or so to write it all down is sometimes a challenge. When I travel or take some time off I can either be late, be incomplete, skip the week, or do some combination of the above. This week I am choosing to provide some continuity on the series, while posting a little late.]
This is an especially important week for financial markets, so I am doing my weekly update, even though it is late, and more focused on the future than last week.
Going into this week, the recent economic reports have all been a bit disappointing -- nothing terrible, but a little worse than expectations.
The timing of the weaker data coincides with seasonal patterns from the last two years and the anticipated end of the current Fed "Operation Twist." It raises the question: Have we reached an economic turning point?
Friday's employment report will be the most important evidence, but the rest of the week includes many of the most important economic reports. I will offer my guess about what to expect in the conclusion, but first let us do our regular review of last week's news and data.
Background on "Weighing the Week Ahead"
There are many good sources for a comprehensive weekly review. I single out what will be most important in the coming week. My theme is an expert guess about what we will be watching on TV and reading in the mainstream media. It is a focus on what I think is important for my trading and client portfolios.
Unlike my other articles, I am not trying to develop a focused, logical argument with supporting data on a single theme. I am sharing conclusions. Sometimes these are topics that I have already written about, and others are on my agenda. I am trying to put the news in context.
Readers often disagree with my conclusions. Do not be bashful. Join in and comment about what we should expect in the days ahead. This weekly piece emphasizes my opinions about what is really important and how to put the news in context. I have had great success with my approach, but feel free to disagree. That is what makes a market!
Last Week's Data
Each week I break down events into good and bad. Often there is "ugly" and on rare occasion something really good. My working definition of "good" has two components:
- The news is market-friendly. Our personal policy preferences are not relevant for this test. And especially -- no politics.
- It is better than expectations.
The general economic data continues to be a little soft, while earnings have been very good.
- Corporate earnings have been stronger than expected and so have revenues. Some observers continually write that earnings estimates are too optimistic. When the beat rate is excellent, they then say that the bar was set too low. One analyst from my geographical region has a convoluted explanation about why earnings are not as good as they seem. This is the same guy who has been saying that the chance of recession is 50-50 and warning that earnings could plummet by more than 50%. He gets big time exposure both from Barry Ritholtz and CNBC, but has no published record of forecasting either earnings or recessions. Can we ask for some accountability?
- The ISM report was great -- 54.8 -- reaching levels from early last year. The underlying components were also very good. The ISM's research suggests that this index level (if annualized) is consistent with GDP growth of 4.1%. See the detailed analysis and charts from Steven Hansen.
- Reported GDP growth understates economic strength. It is all about the inventory changes. Inventories have moved lower, which hurts GDP. When inventories go up, bearish pundits say that the number is overstated and bullish pundits argue that businesses expect the need for more goods. It is confusing, but Bob McTeer shows that the data are actually pretty good. He explains why the first quarter report of 2.2% is actually stronger than Q411's 3.0%.
- The Fed acted as expected, and Bernanke's explanation (We'll be there if needed.) was understood.
The economic news last week was disappointing, with everything a touch worse than expected.
- Initial jobless claims continued at a high level. We are getting outside the time frame where pundits can blame an early Easter. Those of us who rely on data and watch the four-week moving average are concerned about the higher level of initial claims.
- GDP Growth was weak. Taking a somewhat different perspective from McTeer, Calculated Risk considers a number of factors, including weather.
- Social Security and Medicare are running out of money sooner than expected. Who could have known?
- Various lesser economic reports are all slightly worse than expectations. It is becoming a trend -- and one worth watching.
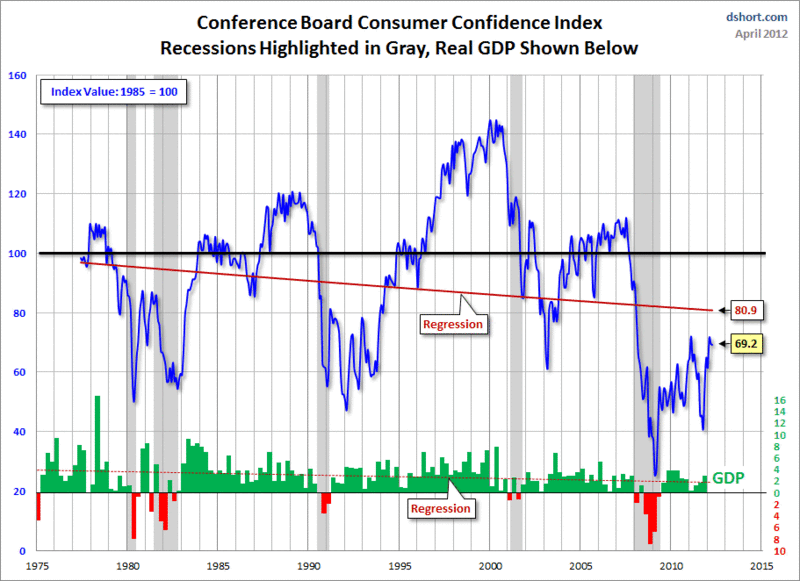
- The Conference Board Consumer Confidence index is still at recessionary levels (via Doug Short).

The Ugly
Florida State is eliminating its Computer Science Department to save less than $2 million while increasing the athletic budget by a larger amount. I understand that football generates direct revenue and the nerds and geeks do not -- but still.......Something is wrong here.
The Indicator Snapshot
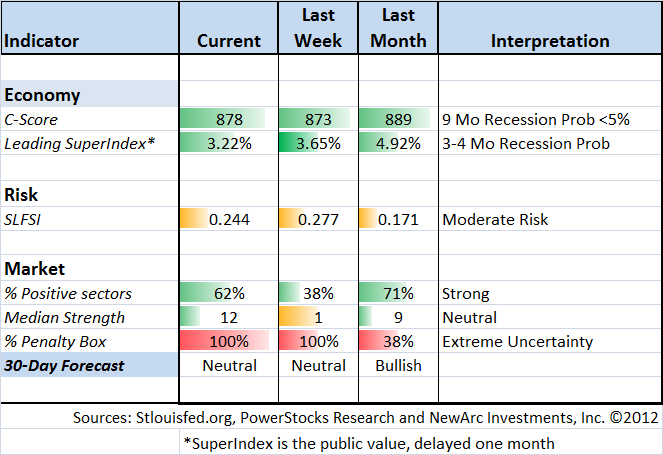
It is important to keep the current news in perspective. My weekly snapshot includes the most important summary indicators:
- The St. Louis Financial Stress Index.
- The key measures from our "Felix" ETF model.
- An updated analysis of recession probability.
The C-Score is a weekly interpretation of the best recession indicator I found, Bob Dieli's "aggregate spread." I'll explain more about the C-Score soon. Bob also has a group of coincident indicators. Like most of the top recession forecasters, he uses these to confirm the long-term prediction. These indicators are not close to a recession signal. Bob has graciously offered the most recent report as a free sample for our readers.
I am a big fan of Dwaine van Vuuren, whose excellent statistical work is giving us better insight into a wide range of recession forecasting methods. The data point that I cite each week (the four-month recession outlook) is only one aspect of a comprehensive report. The SuperIndex includes nine different methods, including the ECRI. The analysis has a very strong, practical market application which has paid off richly for subscribers over the last few months. How? Mostly by putting the ECRI recession forecast into better perspective. I am publishing the one-month delayed Leading SuperIndex estimate of recession probability in the near future -- three or four months. This is plenty of time to have value for public followers of their reports.
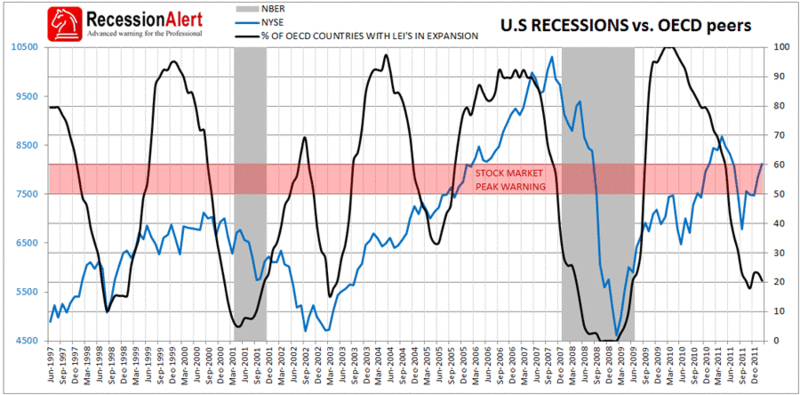
Dwaine seems to produce another interesting report every week. At at time when there is worldwide economic pressure, many want to know whether the US economy can escape. Here is a great chart:

To understand the continuing relative strength of the US economy, you should read the complete article, which reaches the following conclusion:
"The next few months behavior of this index will be interesting to watch but we can make one observation about the current levels and that is it is not indicative of a pending stock market correction or peak. If anything, if the index starts pointing upwards, this will signal continued U.S stock market gains."

Our "Felix" model is the basis for our "official" vote in the weekly Ticker Sense Blogger Sentiment Poll. We have a long public record for these positions. Two weeks ago we shifted from bearish back to neutral. The last several weeks have been pretty close calls. The ratings have improved a bit. The inverse ETFs are no longer at the top of the list, so I would not be surprised to see a little buying next week.
[For more on the penalty box see this article. For more on the system ratings, you can write to etf at newarc dot com for our free report package or to be added to the (free) weekly ETF email list. For daily ETF commentary from Felix, you can sign up for Wall Street All-Stars, where I still have a few discounted memberships available. You can also write personally to me with questions or comments, and I'll do my best to answer.]
The Week Ahead
The big story this week will be Friday's employment report, but the calendar has created another deluge of data.
I am very interested in the ISM reports on manufacturing and services, since these give great insight into employment.
The ADP private employment report (Wed) is also significant, since it provides an interesting and credible alternative to the regular BLS approach. Initial claims (Thurs) are also significant, even though the data are out of the survey range for Friday's report.
There are other reports, but the big story will be about jobs.
Trading Time Frame
We mostly out of the market last week in trading accounts, after a long period when Felix caught the rally pretty well. We have a small bond position -- a further indication of caution.
The current market has been confusing to many top professionals, as I reported in this article featuring commentary from Art Cashin. Many wannabe traders look at big market moves and think that this means they should be doing something.
This is wrong!
Traders must act only when they have edge. Wild volatility may look like opportunity, but it only works if you are calling the turns. The most important decision is to act only when you have edge.
Investor Time Frame
For investment accounts I have been buying on dips in stocks that we like. I tried to explain the most important concept for individual investors in this article about the Wall of Worry. I have had many emails from people who had a personal breakthrough in their investing when they understood this concept. If you missed it, I urge you to take a look.
Investors should not be trying to guess the next market move. Instead, take what the market is giving you. I have been offering this advice for months, and it led to a great quarter for anyone taking heed.
If you are really worried, you can imitate our enhanced yield program. Buy good dividend stocks and sell short-term calls. I am targeting 8-9% returns on this approach, and achieving it no matter what the market is doing. You can, too. This has been meeting objectives in spite of the market twists and turns.
Final Thoughts on the Turning Point
When it comes to the economy I am watchful and wary, but I do not yet see a turning point. Many investment managers sharpened up their tools after 2008. Regular readers can join me in monitoring both systemic risk and recession risk.
Both remain much lower than headline risk!
The market makes new highs in spite of the headline risk that sells newspapers, but it is no surprise to those who follow data on corporate earnings, recession risk, or the declining chances of a financial meltdown.
Meanwhile, those who emphasize slogans have downplayed "upside risk." Here are two developments to consider:
- Could housing be improving? I have been stodgily bearish, but I am seeing construction in my area. Calculated Risk sees signs of a bottom. Our Felix model likes home builders, although the sector is still in the penalty box. Most people do not realize that the housing decline has been subtracting 1 to 1.5% from GDP growth. Even a flat housing market is an improvement.
- Can there by stimulus from energy? I wonder if most people even noticed this interesting op-ed piece in the FT by Philip K Verleger Jr., former Director of the Office of Energy Policy at the US Treasury. He points out that US economic growth has consistently exceeded expectations, and makes a bold prediction for the next decade:
Readers should check out the entire article, if only to provide an alternate perspective about economic growth prospects.
