The economic calendar is moderate, with the FOMC decision, retail sales and inflation data. None of these promises to create a big market movement. With the temptation to look to next year, I expect plenty of discussion about the extended bull market. Expect many to be asking in frustration:
Will this never end?
The Story in One Chart
I always start my personal review of the week by looking at a great chart. This week I am featuring the version from Investing.com. If you visit the original, you will see many interactive features, including the news events indicated on the chart.
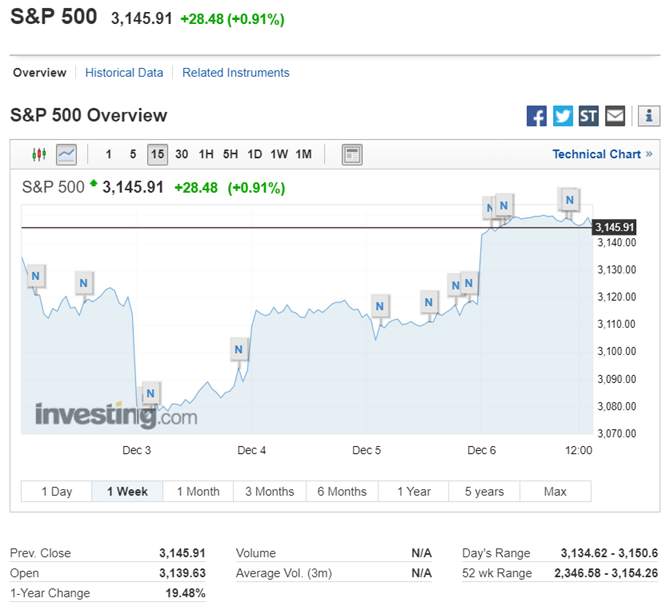
The market gained 0.2% for the week. The quiet overall results conceal the trading range of 2.6%. You can monitor volatility, implied volatility, and historical comparisons in my weekly Indicator Snapshot in the Quant Corner below.
Personal Note
Mrs. OldProf and I are finishing our trip this weekend. She knew that I had some market ideas percolating and urged me to write something, sticking to the most important ideas. And BTW, no earthquakes so far!
The News
Each week I break down events into good and bad. For our purposes, “good” has two components. The news must be market friendly and better than expectations. I avoid using my personal preferences in evaluating news – and you should, too!
New Deal Democrat’s high-frequency indicators are an important part of our regular research. The results remain positive for the long term but have turned neutral for coincident and short-term indicators.
The Week Ahead
We would all like to know the direction of the market in advance. Good luck with that! Second best is planning what to look for and how to react.
The Calendar
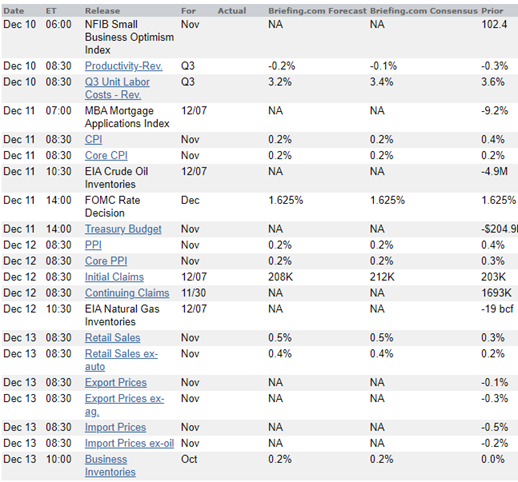
The economic calendar is relatively modest despite the mid-week FOMC decision. The NFIB index and retail sales are the most interesting of the reports. CPI and PPI will be important someday, but not yet.
Briefing.com has a good U.S. economic calendar for the week. Here are the main U.S. releases.
Next Week’s Theme
There is little excitement on the calendar, leaving plenty of time for the pontificating punditry. A continuing theme of frustration is the length of the stock market rally. So many – bond guys, newsletter writers, media sales types, sellers of annuities and structured products, and those hawking gold – use fear to fuel their businesses.
Many are asking (in frustrated tones): When will the stock rally end?
There will be an end, of course, but many are amazed at the longevity of this bull. The best gift I can offer to readers has two parts. First, I’ll cover things that I ignore—and you should, too!
Then I’ll mention a few things well worth watching.
What to Ignore.
An example of these arguments comes from the reliably bearish John Mauldin’s Inflationary Angst. As usual, it is a long post, so let me take a typical example. Mauldin questions the Fed’s 2% target, showing the effect of compounding. He does not mention the reason for the target—the extra danger of missing on the low side. The Fed can address inflation more easily than reflation. Instead of discussing this reason he plays upon a common misconception. OK, here’s a second example. Like most critics, he cannot resist talking about hedonic adjustments in prices. This is another one that few understand and sounds silly to the average person. His example is discussing a car that has “new features.” But what about a car with a life expectancy of 150,000 miles instead of 50,000? Or how about safety features that increase the survival odds of the occupants.
This is a severe problem since it leaves him with no measurement for inflation. I happen to agree that it is a potential problem, so I watch the inflation indicators carefully. What does he monitor?
What to Watch
I’ll have some additional observations in today’s Final Thought.
Quant Corner and Risk Analysis
I have a rule for my investment clients. Think first about your risk. Only then should you consider possible rewards. I monitor many quantitative reports and highlight the best methods in this weekly update, featuring the Indicator Snapshot.
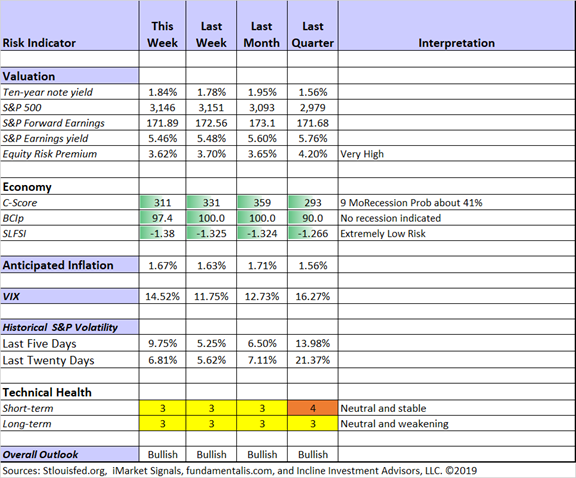
Both long-term and short-term technical indicators remain neutral. I use this information to assist in entries and exits planned for other reasons.
Recession risk remains in the “watchful” area. There is little confirmation for the risk signals, which we have been monitoring since May. Many observers who reacted to the yield-curve inversion have become less worried.
Some readers have asked how my conclusion can be bullish when technical indicators are weak. The outlook is intended for investors. For them, the technical indicators are mostly useful to guide specific entry and exit pionts. An attractive equity risk premium and modest recession odds are the keys for investors.
The Featured Sources:
Bob Dieli: Business cycle analysis via the “C Score”.
Brian Gilmartin: All things earnings, for the overall market as well as many individual companies.
Georg Vrba: Business cycle indicator and market timing tools. The most recent update of Georg’s business cycle index does not signal recession.
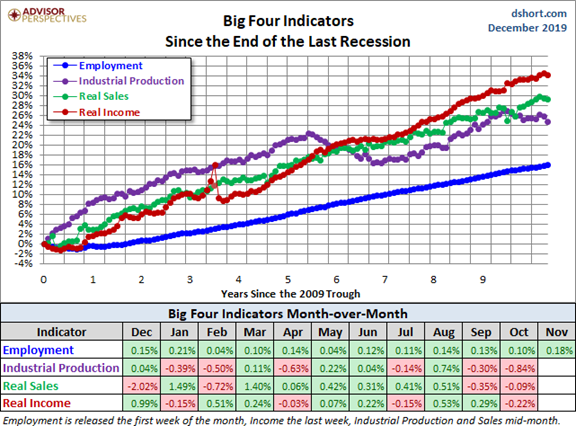
Doug Short and Jill Mislinski: Regular updating of an array of indicators. Great charts and analysis. Especially useful is the regular update of the “Big Four” indicators emphasized by the NBER in dating recessions. Remember – a recession occurs when there is a big decline from a peak.
Insight for Investors
Investors should understand and embrace volatility. They should join my delight in a well-documented list of worries. As the worries are addressed or even resolved, the investor who looks beyond the obvious can collect handsomely
Best of the Week
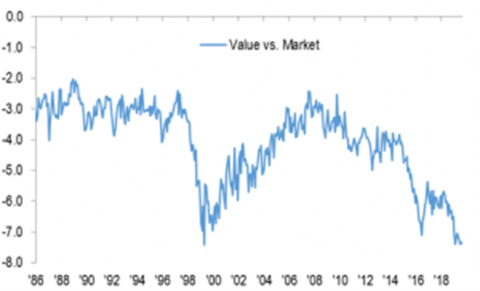
If I had to recommend a single, must-read article for this week, it would be the 3rd Quarter Report from the Miller Value Fund. It includes an excellent compilation of historical trends in value stocks, the overall market and low volatility stocks.
Yet, low volatility securities today are at a significant valuation premium to the overall market and are approaching valuation levels that are on par with some growth stocks. It appears the market’s quest for higher income has coincided with rising economic fear causing an excessive premium for this perceived “safety” group. Similar to bonds, given current valuation levels we see less attractive future return potential for low volatility securities. In some cases, there is a growing risk that future returns could be negative if valuation multiples contract and overwhelm their income contribution.
And further…
Many value securities’ market prices appear to be already discounting a lot of current market concerns, including a potential recession. But how inexpensive are Value stocks today? The price-to-earnings multiple for the value universe is in the low double digits, with the lowest valuation securities closer to 8x! The most expensive portion of the market has a P/E multiple that is 10x greater than the least expensive! As the chart below highlights, the price-to-earnings discount of value equities to the overall market is approaching 1999/2000 lows. When we have seen similar valuation spreads, future returns have been quite attractive for value securities, from 2000 to 2006 value significantly outperformed growth and the overall market.
Final Thought
There are finally a few observers who are considering an economic rebound leading to a longer bull market. Michael Santoli surveys key opinions.
Mike Williams does a lot of myth-busting in Long Live the Consensus. He provides a realistic review of employment data, housing, and earnings growth. Amazingly, the bearish reaction of investors is in sharp contrast. This combination is a good opportunity for investors.
The buying opportunity in value stocks and small caps continues. I continue to shop in those groups as well as stocks hurt by tariffs.
And don’t get caught up with daily comparisons of your portfolio with the S&P 500. If you are beating the market, you probably have a dangerous asset allocation.
