
Quant Corner and Risk Analysis
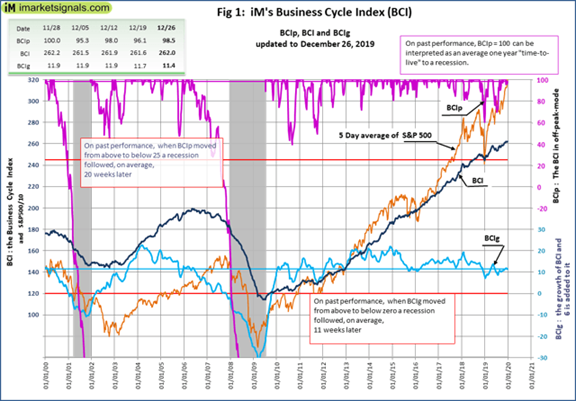
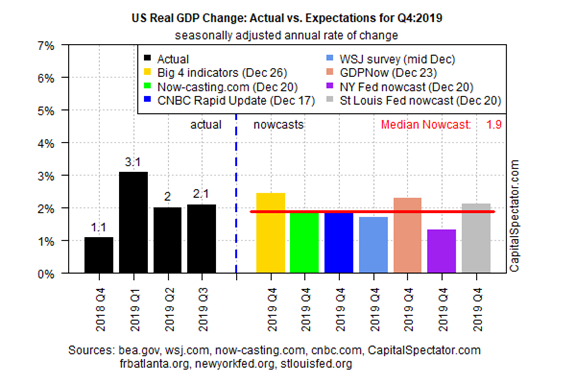
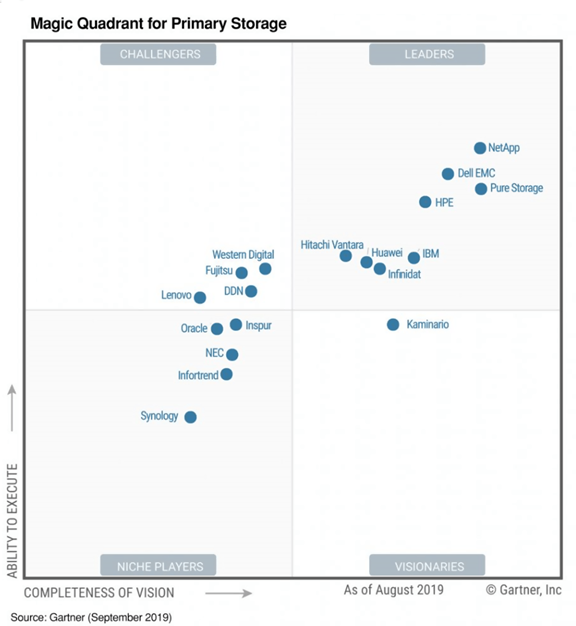
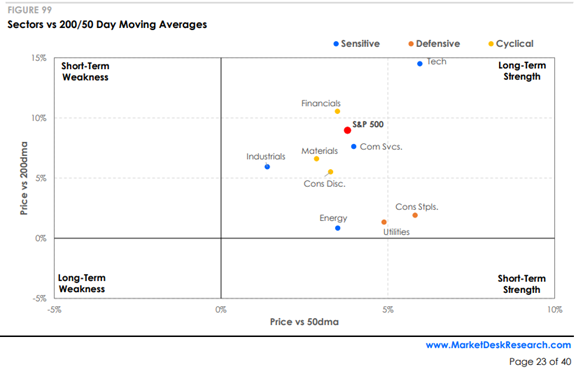
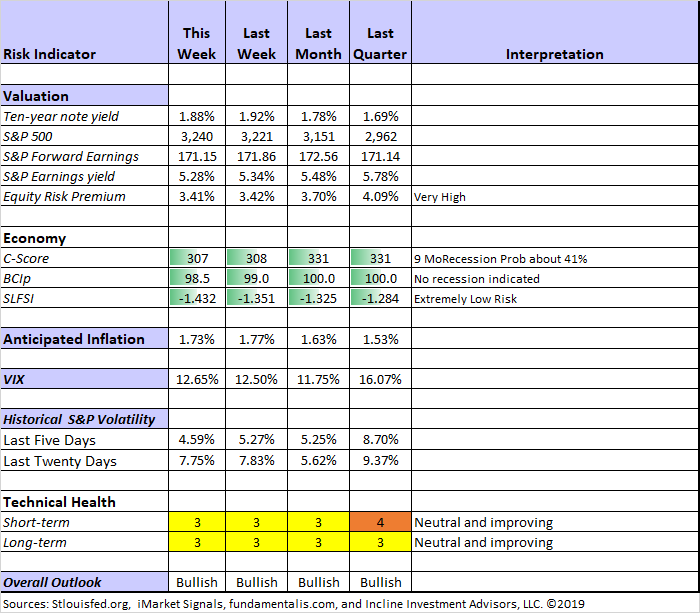
I have a rule for my investment clients. Think first about your risk. Only then should you consider possible rewards. I monitor many quantitative reports and highlight the best methods in this weekly update, featuring the Indicator Snapshot.Both long-term and short-term technical indicators remain neutral, but continue to show improvement.Recession risk remains in the “watchful” area. There is little confirmation for the risk signals, which we have been monitoring since May.The Featured Sources:Bob Dieli: Business cycle analysis via the “C Score”.Doug Short and Jill Mislinski: Regular updating of an array of indicators. Great charts and analysis.Brian Gilmartin: All things earnings, for the overall market as well as many individual companies.Georg Vrba: Business cycle indicator and market timing tools. The most recent update of Georg’s business cycle index does not signal recession. Georg describes the BCI as “designed for a timely signal before the beginning of a recession.Brian Gilmartin observes that the forward earnings yield “is as low as I’ve seen it post 2008.”Brian is our source for earnings data in the Indicator Snapshot. The low earnings yield is the result of the increase in the S&P 500 at a time when earnings expectations are not growing. For now, I have continued to treat the equity risk premium as “very high.” It is important to compare the earnings yield to inflation expectations and to bond yields. If investors expected higher inflation, they would not pay as much for earnings.The weekly indicator snapshot provides all this information. But Brian is accurately identifying a metric we should be watching. My own expectation is that the economic improvement I expect will be reflected in higher earnings – the opposite of what we saw as trade war effects accumulated.Guest SourcesJames Picerno provides an update of his Q4 median GDP forecast – “on track to stabilize.”Insight for TradersOur weekly “Stock Exchange” series is written for traders. I try to separate this from the regular investor advice in WTWA. There is often something interesting for investors, but keep in mind that the trades described are certainly not suitable for everyone. My colleague Todd Hurlbut, Chief Investment Officer at Incline Investment Advisors, LLC has been collaborating on this series. This week’s post was Time to Batten Down the Hedges? We take up the question of risk control and whether to prefer stop loss orders or hedging. As always, the trading models share some recent action which Todd analyzes.Insight for InvestorsInvestors should understand and embrace volatility. They should join my delight in a well-documented list of worries. As the worries are addressed or even resolved, the investor who looks beyond the obvious can collect handsomelyBest of the WeekIf I had to recommend a single, must-read article for this week, it would be Eddy Elfenbein’s announcement of his 2020 buy list. It reflects the decision process of a great buy-and-hold investor. He announces the 25 stocks before he buys them and holds them for an entire year. Each year he drops five names and adds five others. Investors can learn from these decisions and get ideas for their own research. Alternatively you can join me by investing in his unique ETF, CWS.Eddy updates the news on each stock on a weekly basis, providing added value throughout the year.Stock IdeasStone Fox Capital makes an important observation about stock buybacks. The dollar amount is less important than the percentage reduction in share count. Biogen (NASDAQ:BIIB) has approved plans for another 10%.Michael A. Gayed combines analysis of NetApp (NASDAQ:NTAP) with an explanation of the hybrid cloud computing market. If this chart catches your interest, as it did mine, read the post for the full analysis.Want Yield?Blue Harbinger analyzes EPR Properties (EPR) explaining that the recent price decline is the result of “macroeconomic noise.” [Jeff – I agree with the idea that REITs move in lockstep when there is an interest rate story. In particular cases this move is exaggerated or unwarranted. Does the argument apply here?] He notes the special focus of this REIT, “experiential real estate, including property types such as theaters, eat and play, ski, attractions, experiential lodging, gaming, fitness and wellness, cultural and live venues.The Stanford Chemist’s regular update of closed-end funds includes the following:Individual CEFs that have undergone a significant decrease in premium/discount value over the past week, coupled optionally with an increasing NAV trend, a negative z-score, and/or are trading at a discount, are potential buy candidates.Check out the accompanying table, along with a similar discussion of sell candidates.Peter F. Way applies his Market Maker hedging analysis to the airline sector. The risk/reward pick? Hawaiian Holdings (HA). [See Great Rotation hint below].What about Boeing (NYSE:BA)?Michael A. Gayed cautions about the effect of the 737 Max production suspension. Possible investor entry below $300?Barron’s opines that the risks for investors remain too high.Firing the coach is a time-honored strategy. John M. Mason warns that changing the CEO may not be enough. A change of the corporate culture is needed, which might require finding outside talent.Peter F. Way describes the price effect on the Market Maker hedging range.The Great RotationAcademic research is confirming the results apparent to investors and market observers. A new paper from Fed economists concludes:Since the beginning of 2018, the United States has undertaken unprecedented tariff increases, with one goal of these actions being to boost the manufacturing sector. In this paper, we estimate the effect of the tariffs—including retaliatory tariffs by U.S. trading partners—on manufacturing employment, output, and producer prices. A key feature of our analysis is accounting for the multiple ways that tariffs might affect the manufacturing sector, including providing protection for domestic industries, raising costs for imported inputs, and harming competitiveness in overseas markets due to retaliatory tariffs. We find that U.S. manufacturing industries more exposed to tariff increases experience relative reductions in employment as a positive effect from import protection is offset by larger negative effects from rising input costs and retaliatory tariffs. Higher tariffs are also associated with relative increases in producer prices via rising input costsThese effects were gradual, not noticed day-by-day but cumulative over a longer period of time. Cessation of the trade war will reverse many of these impacts, but that will also take time.David Templeton (HORAN) discusses the steeper yield curve and how that could help the financial sector.Final ThoughtI plan to use my new-found semi-retirement time and location to change priorities a bit. These are not resolutions, per se, since most are things I am already doing. It is more a matter of emphasis. Here are ideas directly related to my investment writing. I’ll start with some key results from last year and then move on to my plans.Last year I achieved certain objectives in my investment management, and I hope that readers joined in:
- Stayed on the right side of the market.
- While I rarely publish holdings in our client portfolios, I frequently identify sectors that look good. In 2019 my semiconductor outlook and emphasis on homebuilders were both on target.
- Recognized the “false signal” of the December recession scare and the dubious message of the yield curve inversion in May.
- Identified the causal path behind the weakening economy.
- Called out some bogus writing and conclusions.
- Changed the WTWA emphasis to include more content on what was currently important, even though others might not be following it.
- Identified the “critical moment” for markets – a story still in progress.
Next year I have the following ideas in mind:
- Periodically revise my list of most important items and make sure to write about them.
- Emphasize the importance of time frames in spotting trends.
- Initiate a new weekly column with rotating themes. One thematic idea is “close reading.” I want to show how superficially persuasive opinions often have little support.
- Initiate my occasional videocast emphasizing bad charts.
- Write some posts that are strictly educational.
And yes, Mrs. OldProf says that some of the new-found time should be used for fun.Investor Reading SuggestionInstead of reading market forecasts and stories about what worked last year, read about developments in other fields. Many of these represent strong tendencies that suggest investment opportunities. Here are a few that I am reading, but please add your own ideas in the comments.Countdown: The 10 most important tech trends of the decadeSome of these are now so commonplace that they are taken for granted.10 Amazing Product Development Innovations of the 2010sDiscussing these ideas at an investment club might help your imagination of what trends and companies to consider.The Top 10 Innovations of the DecadeThis one is for fun and contrast. It was written in 2009. Wikipedia, Napster, GPS, Google (NASDAQ:GOOGL).These are the top 20 Scientific discoveries of the decade. I am especially interested in DNA editing. If the progress is fast enough, it will exacerbate the Social Security financing problems.The biggest tech breakthroughs of the last decade.I expect cyber crime to become even more important.25 major technological advances of the last decade. I put this one last since I do not like the slide show approach. Some of the ideas overlap other articles, but this is the only place I saw “digitized diaper monitoring.”Great Rotation Hint of the WeekMy screening process yielded HA as one of our picks. I did not get it from Peter F. Way’s method, but it is nice to see support from the market makers.This chart from MarketDesk illustrates the shift in sector strength that I am monitoring and trading.There was plenty of excitement in the last decade, but you won’t find it from reading about what stocks did well.Take advantage of this time to think about major trends in all fields. Then you can make your own gentle “forecasts.”[Has your portfolio kept up with the changes over the last year? If you are unsure, write for my brief paper on Four Signs of Portfolio Trouble. Just send an email request to info at inclineia dot com].
Some other items on my radar
I am trying to put the worries aside for the holidays. These are not the main stories, so I’m going to focus on some new ideas. But don’t call me complacent!!
The economic calendar is normal in another week split by a holiday. Many market participants will not show up until Thursday – and perhaps not even then. The ISM reports, manufacturing and non-manufacturing, are both post-holiday. My guess is that the financial media will continue the attention to 2020 outlook ideas. Some reporters will take a look instead at events from the past decade. This raises a good question for our consideration:
The economic calendar is normal in another week split by a holiday. Many market participants will not show up until Thursday – and perhaps not even then. The ISM reports, manufacturing and non-manufacturing, are both post-holiday. My guess is that the financial media will continue the attention to 2020 outlook ideas. Some reporters will take a look instead at events from the past decade. This raises a good question for our consideration:
Does analyzing history improve our market forecasts?
Last Week Recap
In my last installment of WTWA, I accurately predicted continuing discussion of 2020 outlook from some names and faces that are not as familiar to the investment community. That was pretty easy. There was discussion of my theme, complacency, since that is a popular way of describing the market.
The Story in One Chart
I always start my personal review of the week by looking at a great chart. This week I am featuring the version from Investing.com. If you check out the interactive chart, you can see the related news sources and add your own indicators.
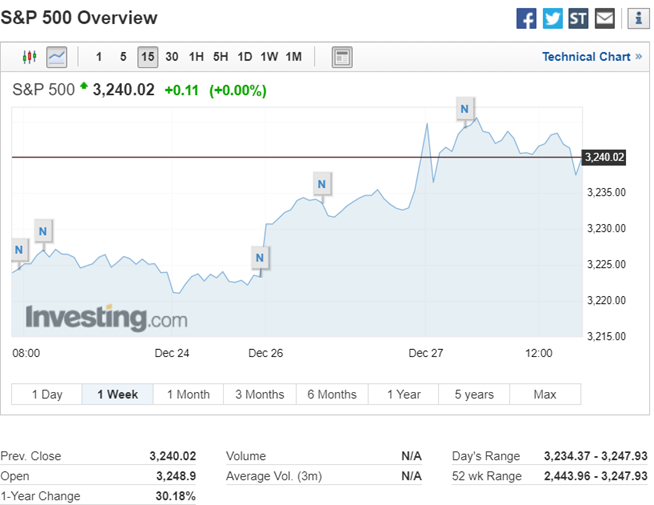
The market gained 0.6% for the week. The trading range was only 0.7%. The media portrayed this as a “grind upward,” and I suppose that is technically correct. Not much was happening. Daily volume was less than half that of the prior week. You can monitor volatility, implied volatility, and historical comparisons in my weekly Indicator Snapshot in the Quant Corner below.
Noteworthy
A philosophy professor was concerned about poor student performance. To test an idea, he offered extra credit to students who would give him their cell phones for nine days and then write about the experience. I cannot summarize the results without spoiling the story, but please make your own guess about what happened before reading it. The original experiment was in 2014. Last year he repeated it in a different environment. There was a dramatic difference in the results, but again, not what you might think. (MIT Technology Review).
The News
Each week I break down events into good and bad. For our purposes, “good” has two components. The news must be market friendly and better than expectations. I avoid using my personal preferences in evaluating news – and you should, too!
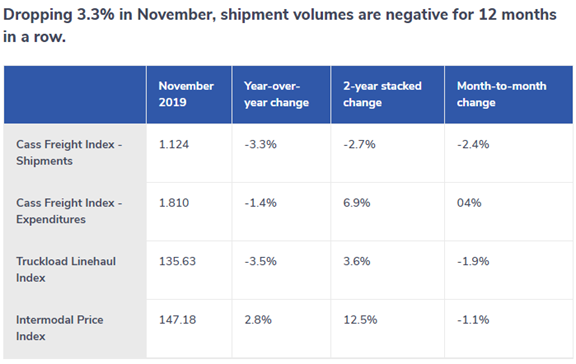
New Deal Democrat’s high frequency indicators are an important part of our regular research. The results remain positive in both the long- and concurrent-time frames, and the short-term forecast has improved to neutral. NDD continues to highlight the metrics to watch if concerned about manufacturing weakness spreading to the consumer. I suggest that readers check out the full post to appreciate the comprehensive nature of this work.
The Good
The Bad
The Ugly
Ugliness does not cease during the holiday time, but I’m not going to discuss it this week.
The Week Ahead
We would all like to know the direction of the market in advance. Good luck with that! Second best is planning what to look for and how to react.
The Calendar
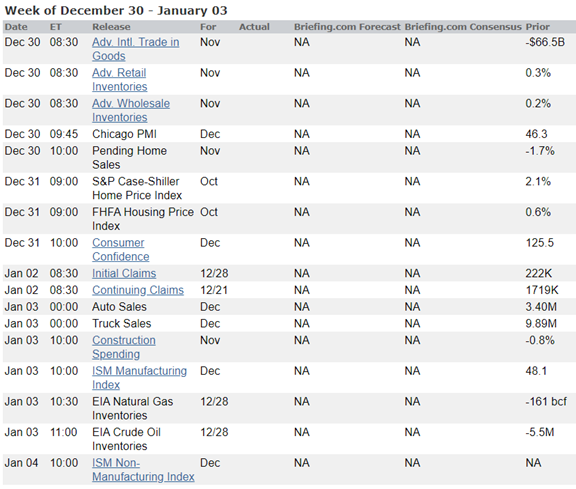
The economic calendar is normal with the important reports (ISM Manufacturing, ISM Services, and auto sales) scheduled for a Thursday or Friday release. If last week’s pattern repeats, we will have a quiet week with plenty of time for continued year-end assessments.
Congress is on recess and the President is on vacation, but don’t expect the political news to stop!
Briefing.com has a good U.S. economic calendar for the week. Here are the main U.S. releases.
Next Week’s Theme
Many market participants will not report back until Thursday. Investment committees may not meet until January 7th. The weeks with a holiday on Wednesday create an unusual trading environment. I’m not sure how the punditry will find fresh topics, but I expect the 2020 forecasts to continue. With that in mind, let’s take a deeper look at the foundation for market forecasts. In particular:
Does analyzing history improve market forecasts?
Background
Since the 2016 election there has been a growing attack on expertise. Populism seemed to encourage the idea that everything is just a matter of opinion, and all opinions are equal. The outcome of the election and the apparent failure of the major polls encouraged this meme. It seems like anyone who is predicting anything is a target for scorn, usually accompanied by a Yogi Berra quote or one about making fortunetellers look good.
In sharp contrast, the same sources report economic data without any attention to confidence intervals or past accuracy of the source. They feature charts of past data and trends, but without making a prediction. What do they expect the reader to do with this information? The sources are inviting inferences. This transfers the forecasting responsibility to the reader, avoiding any possible blame on the part of the author.
If all forecasts are terrible, what is the point of reporting data? It is past time for someone to think carefully about what a useful forecast entails.
My inspiration
Jeff Sommer (NYT) writes Forget Stock Market Forecasts. They’re Less Than Worthless.He calls forecasts by Wall Street strategists “flagrantly inaccurate” comparing them to a perma-sunny weather forecaster. Based on some calculations from Paul Hickey of Bespoke Investment Group (a reliable source), he summarizes the median forecasts and market returns since 2000. “On average” he summarizes:
The median forecast was that the stock index would rise 9.8 percent in the next calendar year. The S&P 500 actually rose 5.5 percent.
The gap between the median forecast and the market return was 4.31 percentage points, an error of almost 45 percent.
The median forecast was that stocks would rise every year for the last 20 years, but they fell in six years. The consensus was wrong about the basic direction of the market 30 percent of the time.
Mr. Hickey found that the forecasts were often off by staggering amounts, especially when an accurate forecast would have mattered most. In 2008, for example, when stocks fell 38.5 percent, the median forecast was typically cheery, calling for an 11.1 percent stock market rise. That Wall Street consensus forecast was wrong by 49.6 percentage points, and it had disastrous consequences for anyone who relied on it.
He concludes that investors should just buy index funds.
Mark Rzepczynski, one of my favorite sources, writes What financial forecasters can learn from weathermen. Proclaiming weather forecasters to be the best in any field of study, he praises them for using percentages. He also points out that short-term forecasts are better than those for longer times. He suggests topics for inclusion in a year-end outlook report.
Basis for Criticism?
Neither article provides much help to the average investor.
My Approach
I agree with much of the forecast criticism, and I don’t attempt it. Some analysts even specify detailed scenarios showing the path the market will take during the year. Even a forecast of a 30% gain for the year may not be helpful if there is a 25% decline along the way. Such detailed guesses are not needed to improve investment results. I suggest the usefulness of two factors.
- The attractiveness of stocks relative to other assets.
- The strength of the economy relative to potential. A cool economy generates more corporate earnings as it improves. An overheated economy eventually does the opposite.
- Do not insist on a twelve-month time frame and certainly not a specific calendar year. Some sort of rolling forecast method would be better.
- Focus on risk, not a specific result. Since recessions are associated with the greatest risk to markets, that is a good place to start.
This approach dramatically reduces the chance of big losses and keeps you on the right side of the market most of the time.
Please note that none of these ideas depend upon history. A focus on the prior year history is a losing method, not a basis for forecasting. Here are some examples of what we can and cannot predict.
I hope you can see the recurring theme. Knowing the odds, especially if derived from a solid process, can help your results. Contrast this with a prediction from a big Wall Street firm this week. “There is a 50% chance of a correction.” What do you do with that information? Even after the fact it can be neither proved nor disproved. Now that is a safe forecast!
I’ll have some additional observations in today’s Final Thought.
Does analyzing history improve our market forecasts?
Last Week Recap
In my last installment of WTWA, I accurately predicted continuing discussion of 2020 outlook from some names and faces that are not as familiar to the investment community. That was pretty easy. There was discussion of my theme, complacency, since that is a popular way of describing the market.
The Story in One Chart
I always start my personal review of the week by looking at a great chart. This week I am featuring the version from Investing.com. If you check out the interactive chart, you can see the related news sources and add your own indicators.

The market gained 0.6% for the week. The trading range was only 0.7%. The media portrayed this as a “grind upward,” and I suppose that is technically correct. Not much was happening. Daily volume was less than half that of the prior week. You can monitor volatility, implied volatility, and historical comparisons in my weekly Indicator Snapshot in the Quant Corner below.
Noteworthy
A philosophy professor was concerned about poor student performance. To test an idea, he offered extra credit to students who would give him their cell phones for nine days and then write about the experience. I cannot summarize the results without spoiling the story, but please make your own guess about what happened before reading it. The original experiment was in 2014. Last year he repeated it in a different environment. There was a dramatic difference in the results, but again, not what you might think. (MIT Technology Review).
The News
Each week I break down events into good and bad. For our purposes, “good” has two components. The news must be market friendly and better than expectations. I avoid using my personal preferences in evaluating news – and you should, too!
New Deal Democrat’s high frequency indicators are an important part of our regular research. The results remain positive in both the long- and concurrent-time frames, and the short-term forecast has improved to neutral. NDD continues to highlight the metrics to watch if concerned about manufacturing weakness spreading to the consumer. I suggest that readers check out the full post to appreciate the comprehensive nature of this work.
The Good
The Bad

The Ugly
Ugliness does not cease during the holiday time, but I’m not going to discuss it this week.
The Week Ahead
We would all like to know the direction of the market in advance. Good luck with that! Second best is planning what to look for and how to react.
The Calendar
The economic calendar is normal with the important reports (ISM Manufacturing, ISM Services, and auto sales) scheduled for a Thursday or Friday release. If last week’s pattern repeats, we will have a quiet week with plenty of time for continued year-end assessments.
Congress is on recess and the President is on vacation, but don’t expect the political news to stop!
Briefing.com has a good U.S. economic calendar for the week. Here are the main U.S. releases.

Next Week’s Theme
Many market participants will not report back until Thursday. Investment committees may not meet until January 7th. The weeks with a holiday on Wednesday create an unusual trading environment. I’m not sure how the punditry will find fresh topics, but I expect the 2020 forecasts to continue. With that in mind, let’s take a deeper look at the foundation for market forecasts. In particular:
Does analyzing history improve market forecasts?
Background
Since the 2016 election there has been a growing attack on expertise. Populism seemed to encourage the idea that everything is just a matter of opinion, and all opinions are equal. The outcome of the election and the apparent failure of the major polls encouraged this meme. It seems like anyone who is predicting anything is a target for scorn, usually accompanied by a Yogi Berra quote or one about making fortunetellers look good.
In sharp contrast, the same sources report economic data without any attention to confidence intervals or past accuracy of the source. They feature charts of past data and trends, but without making a prediction. What do they expect the reader to do with this information? The sources are inviting inferences. This transfers the forecasting responsibility to the reader, avoiding any possible blame on the part of the author.
If all forecasts are terrible, what is the point of reporting data? It is past time for someone to think carefully about what a useful forecast entails.
My inspiration
Jeff Sommer (NYT) writes Forget Stock Market Forecasts. They’re Less Than Worthless.He calls forecasts by Wall Street strategists “flagrantly inaccurate” comparing them to a perma-sunny weather forecaster. Based on some calculations from Paul Hickey of Bespoke Investment Group (a reliable source), he summarizes the median forecasts and market returns since 2000. “On average” he summarizes:
The median forecast was that the stock index would rise 9.8 percent in the next calendar year. The S&P 500 actually rose 5.5 percent.
The gap between the median forecast and the market return was 4.31 percentage points, an error of almost 45 percent.
The median forecast was that stocks would rise every year for the last 20 years, but they fell in six years. The consensus was wrong about the basic direction of the market 30 percent of the time.
Mr. Hickey found that the forecasts were often off by staggering amounts, especially when an accurate forecast would have mattered most. In 2008, for example, when stocks fell 38.5 percent, the median forecast was typically cheery, calling for an 11.1 percent stock market rise. That Wall Street consensus forecast was wrong by 49.6 percentage points, and it had disastrous consequences for anyone who relied on it.
He concludes that investors should just buy index funds.
Mark Rzepczynski, one of my favorite sources, writes What financial forecasters can learn from weathermen. Proclaiming weather forecasters to be the best in any field of study, he praises them for using percentages. He also points out that short-term forecasts are better than those for longer times. He suggests topics for inclusion in a year-end outlook report.
Basis for Criticism?
Neither article provides much help to the average investor.
My Approach
I agree with much of the forecast criticism, and I don’t attempt it. Some analysts even specify detailed scenarios showing the path the market will take during the year. Even a forecast of a 30% gain for the year may not be helpful if there is a 25% decline along the way. Such detailed guesses are not needed to improve investment results. I suggest the usefulness of two factors.
- The attractiveness of stocks relative to other assets.
- The strength of the economy relative to potential. A cool economy generates more corporate earnings as it improves. An overheated economy eventually does the opposite.
- Do not insist on a twelve-month time frame and certainly not a specific calendar year. Some sort of rolling forecast method would be better.
- Focus on risk, not a specific result. Since recessions are associated with the greatest risk to markets, that is a good place to start.
This approach dramatically reduces the chance of big losses and keeps you on the right side of the market most of the time.
Please note that none of these ideas depend upon history. A focus on the prior year history is a losing method, not a basis for forecasting. Here are some examples of what we can and cannot predict.
I hope you can see the recurring theme. Knowing the odds, especially if derived from a solid process, can help your results. Contrast this with a prediction from a big Wall Street firm this week. “There is a 50% chance of a correction.” What do you do with that information? Even after the fact it can be neither proved nor disproved. Now that is a safe forecast!
I’ll have some additional observations in today’s Final Thought.


Quant Corner and Risk Analysis
I have a rule for my investment clients. Think first about your risk. Only then should you consider possible rewards. I monitor many quantitative reports and highlight the best methods in this weekly update, featuring the Indicator Snapshot.Both long-term and short-term technical indicators remain neutral, but continue to show improvement.Recession risk remains in the “watchful” area. There is little confirmation for the risk signals, which we have been monitoring since May.The Featured Sources:Bob Dieli: Business cycle analysis via the “C Score”.Doug Short and Jill Mislinski: Regular updating of an array of indicators. Great charts and analysis.Brian Gilmartin: All things earnings, for the overall market as well as many individual companies.Georg Vrba: Business cycle indicator and market timing tools. The most recent update of Georg’s business cycle index does not signal recession. Georg describes the BCI as “designed for a timely signal before the beginning of a recession.Brian Gilmartin observes that the forward earnings yield “is as low as I’ve seen it post 2008.”Brian is our source for earnings data in the Indicator Snapshot. The low earnings yield is the result of the increase in the S&P 500 at a time when earnings expectations are not growing. For now, I have continued to treat the equity risk premium as “very high.” It is important to compare the earnings yield to inflation expectations and to bond yields. If investors expected higher inflation, they would not pay as much for earnings.The weekly indicator snapshot provides all this information. But Brian is accurately identifying a metric we should be watching. My own expectation is that the economic improvement I expect will be reflected in higher earnings – the opposite of what we saw as trade war effects accumulated.Guest SourcesJames Picerno provides an update of his Q4 median GDP forecast – “on track to stabilize.”Insight for TradersOur weekly “Stock Exchange” series is written for traders. I try to separate this from the regular investor advice in WTWA. There is often something interesting for investors, but keep in mind that the trades described are certainly not suitable for everyone. My colleague Todd Hurlbut, Chief Investment Officer at Incline Investment Advisors, LLC has been collaborating on this series. This week’s post was Time to Batten Down the Hedges? We take up the question of risk control and whether to prefer stop loss orders or hedging. As always, the trading models share some recent action which Todd analyzes.Insight for InvestorsInvestors should understand and embrace volatility. They should join my delight in a well-documented list of worries. As the worries are addressed or even resolved, the investor who looks beyond the obvious can collect handsomelyBest of the WeekIf I had to recommend a single, must-read article for this week, it would be Eddy Elfenbein’s announcement of his 2020 buy list. It reflects the decision process of a great buy-and-hold investor. He announces the 25 stocks before he buys them and holds them for an entire year. Each year he drops five names and adds five others. Investors can learn from these decisions and get ideas for their own research. Alternatively you can join me by investing in his unique ETF, CWS.Eddy updates the news on each stock on a weekly basis, providing added value throughout the year.Stock IdeasStone Fox Capital makes an important observation about stock buybacks. The dollar amount is less important than the percentage reduction in share count. Biogen (NASDAQ:BIIB) has approved plans for another 10%.Michael A. Gayed combines analysis of NetApp (NASDAQ:NTAP) with an explanation of the hybrid cloud computing market. If this chart catches your interest, as it did mine, read the post for the full analysis.Want Yield?Blue Harbinger analyzes EPR Properties (EPR) explaining that the recent price decline is the result of “macroeconomic noise.” [Jeff – I agree with the idea that REITs move in lockstep when there is an interest rate story. In particular cases this move is exaggerated or unwarranted. Does the argument apply here?] He notes the special focus of this REIT, “experiential real estate, including property types such as theaters, eat and play, ski, attractions, experiential lodging, gaming, fitness and wellness, cultural and live venues.The Stanford Chemist’s regular update of closed-end funds includes the following:Individual CEFs that have undergone a significant decrease in premium/discount value over the past week, coupled optionally with an increasing NAV trend, a negative z-score, and/or are trading at a discount, are potential buy candidates.Check out the accompanying table, along with a similar discussion of sell candidates.Peter F. Way applies his Market Maker hedging analysis to the airline sector. The risk/reward pick? Hawaiian Holdings (HA). [See Great Rotation hint below].What about Boeing (NYSE:BA)?Michael A. Gayed cautions about the effect of the 737 Max production suspension. Possible investor entry below $300?Barron’s opines that the risks for investors remain too high.Firing the coach is a time-honored strategy. John M. Mason warns that changing the CEO may not be enough. A change of the corporate culture is needed, which might require finding outside talent.Peter F. Way describes the price effect on the Market Maker hedging range.The Great RotationAcademic research is confirming the results apparent to investors and market observers. A new paper from Fed economists concludes:Since the beginning of 2018, the United States has undertaken unprecedented tariff increases, with one goal of these actions being to boost the manufacturing sector. In this paper, we estimate the effect of the tariffs—including retaliatory tariffs by U.S. trading partners—on manufacturing employment, output, and producer prices. A key feature of our analysis is accounting for the multiple ways that tariffs might affect the manufacturing sector, including providing protection for domestic industries, raising costs for imported inputs, and harming competitiveness in overseas markets due to retaliatory tariffs. We find that U.S. manufacturing industries more exposed to tariff increases experience relative reductions in employment as a positive effect from import protection is offset by larger negative effects from rising input costs and retaliatory tariffs. Higher tariffs are also associated with relative increases in producer prices via rising input costsThese effects were gradual, not noticed day-by-day but cumulative over a longer period of time. Cessation of the trade war will reverse many of these impacts, but that will also take time.David Templeton (HORAN) discusses the steeper yield curve and how that could help the financial sector.Final ThoughtI plan to use my new-found semi-retirement time and location to change priorities a bit. These are not resolutions, per se, since most are things I am already doing. It is more a matter of emphasis. Here are ideas directly related to my investment writing. I’ll start with some key results from last year and then move on to my plans.Last year I achieved certain objectives in my investment management, and I hope that readers joined in:
- Stayed on the right side of the market.
- While I rarely publish holdings in our client portfolios, I frequently identify sectors that look good. In 2019 my semiconductor outlook and emphasis on homebuilders were both on target.
- Recognized the “false signal” of the December recession scare and the dubious message of the yield curve inversion in May.
- Identified the causal path behind the weakening economy.
- Called out some bogus writing and conclusions.
- Changed the WTWA emphasis to include more content on what was currently important, even though others might not be following it.
- Identified the “critical moment” for markets – a story still in progress.
Next year I have the following ideas in mind:
- Periodically revise my list of most important items and make sure to write about them.
- Emphasize the importance of time frames in spotting trends.
- Initiate a new weekly column with rotating themes. One thematic idea is “close reading.” I want to show how superficially persuasive opinions often have little support.
- Initiate my occasional videocast emphasizing bad charts.
- Write some posts that are strictly educational.
And yes, Mrs. OldProf says that some of the new-found time should be used for fun.Investor Reading SuggestionInstead of reading market forecasts and stories about what worked last year, read about developments in other fields. Many of these represent strong tendencies that suggest investment opportunities. Here are a few that I am reading, but please add your own ideas in the comments.Countdown: The 10 most important tech trends of the decadeSome of these are now so commonplace that they are taken for granted.10 Amazing Product Development Innovations of the 2010sDiscussing these ideas at an investment club might help your imagination of what trends and companies to consider.The Top 10 Innovations of the DecadeThis one is for fun and contrast. It was written in 2009. Wikipedia, Napster, GPS, Google (NASDAQ:GOOGL).These are the top 20 Scientific discoveries of the decade. I am especially interested in DNA editing. If the progress is fast enough, it will exacerbate the Social Security financing problems.The biggest tech breakthroughs of the last decade.I expect cyber crime to become even more important.25 major technological advances of the last decade. I put this one last since I do not like the slide show approach. Some of the ideas overlap other articles, but this is the only place I saw “digitized diaper monitoring.”Great Rotation Hint of the WeekMy screening process yielded HA as one of our picks. I did not get it from Peter F. Way’s method, but it is nice to see support from the market makers.This chart from MarketDesk illustrates the shift in sector strength that I am monitoring and trading.There was plenty of excitement in the last decade, but you won’t find it from reading about what stocks did well.Take advantage of this time to think about major trends in all fields. Then you can make your own gentle “forecasts.”[Has your portfolio kept up with the changes over the last year? If you are unsure, write for my brief paper on Four Signs of Portfolio Trouble. Just send an email request to info at inclineia dot com].
Some other items on my radar
I am trying to put the worries aside for the holidays. These are not the main stories, so I’m going to focus on some new ideas. But don’t call me complacent!!
