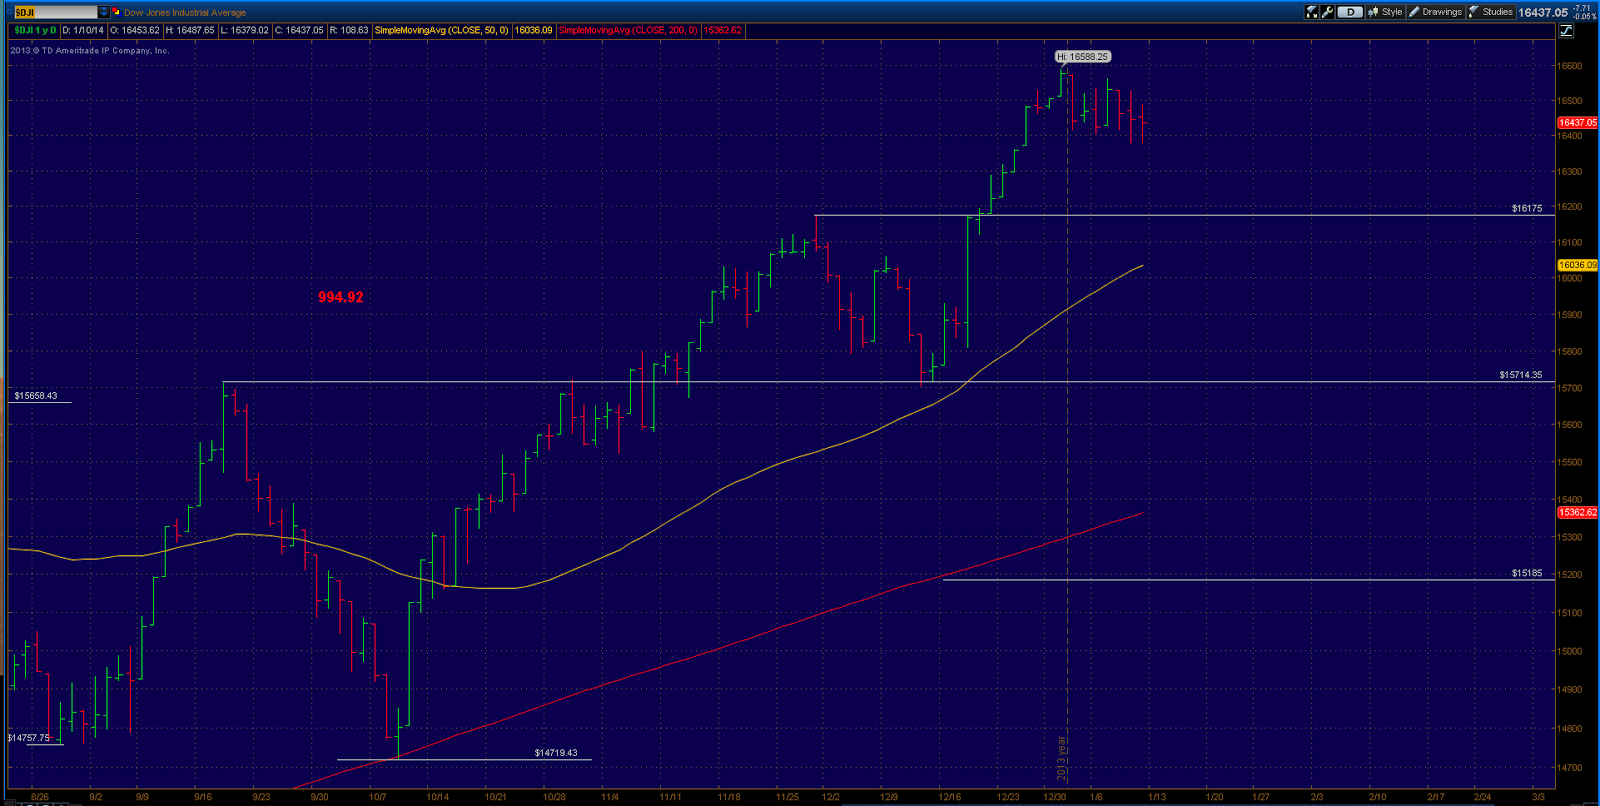
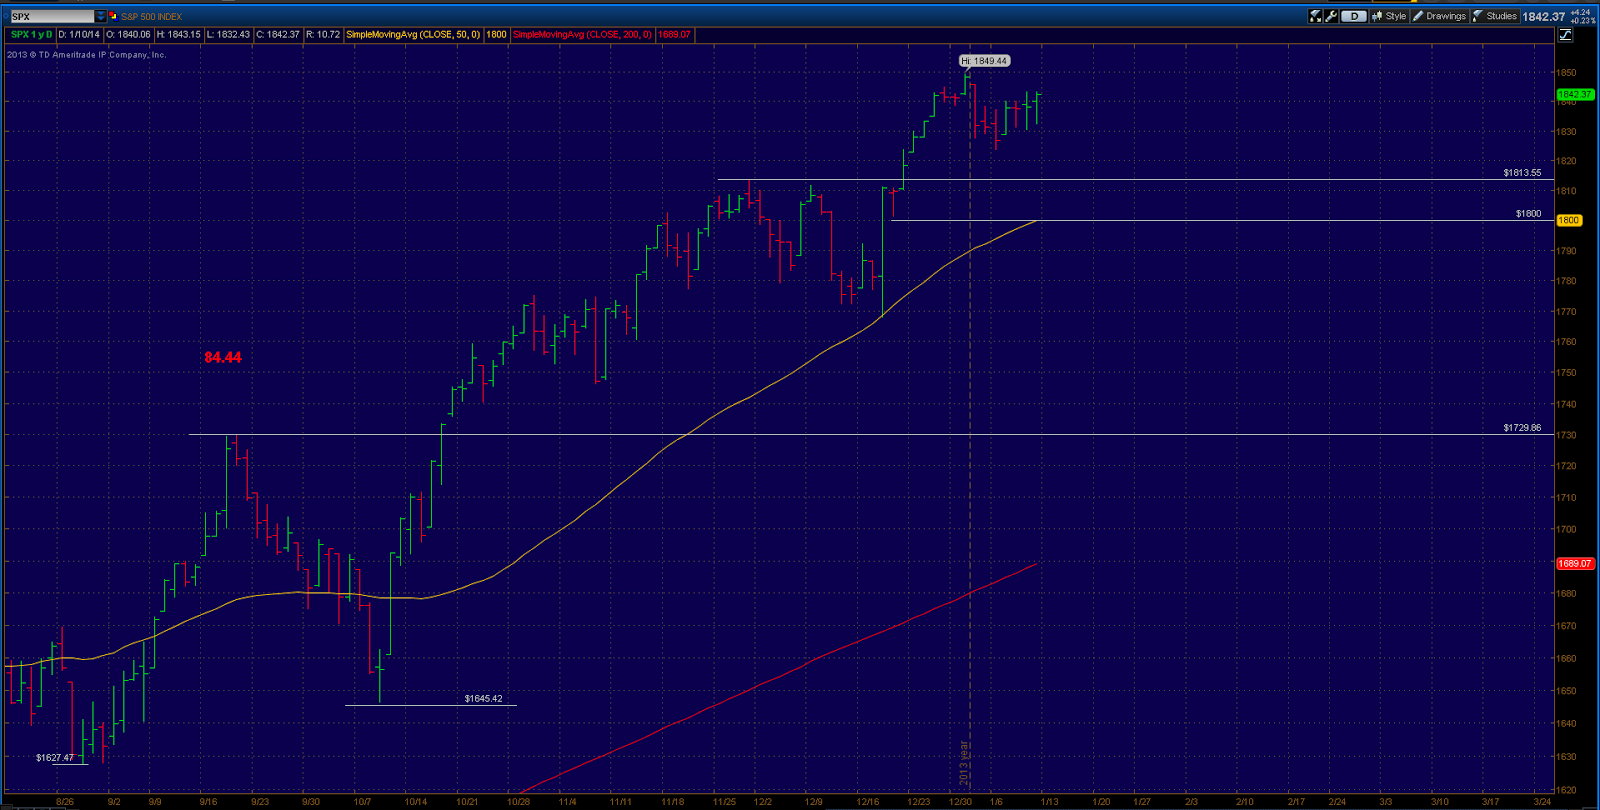
Not a whole lot has changed this week as both the Dow Jones and S+P 500 market averages continue to "digest" the gains accumulated over the holiday's. The charts above show this range bound trade just above short term support zones on both averages.
We have talked at length about the potential technical pitfalls ahead, however with both major averages trading above their respective 50 day and 200 day moving averages and the volatility index still trading in the low teens (which we will see later), there is not a whole lot to get bearish about for the time being.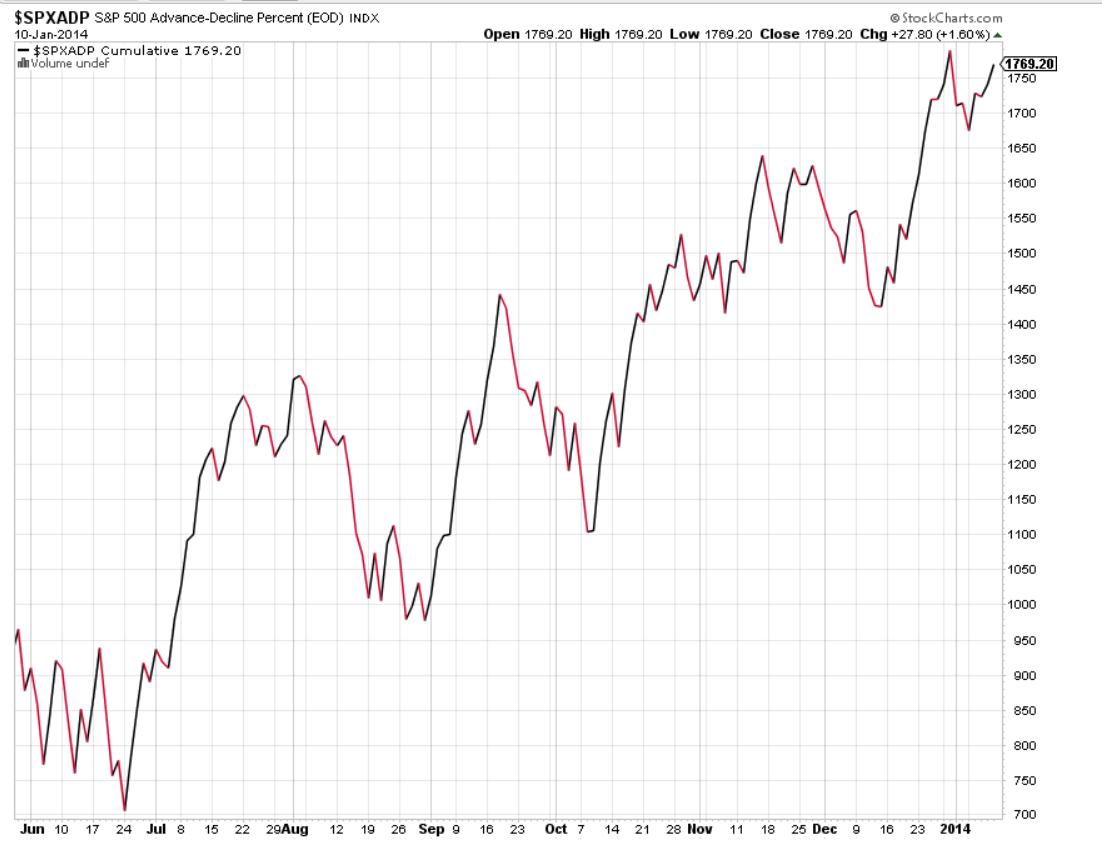
Also in the bull camp, the S+P 500 advance - decline line remains in a solid uptrend and not far off from making another new all time high as well.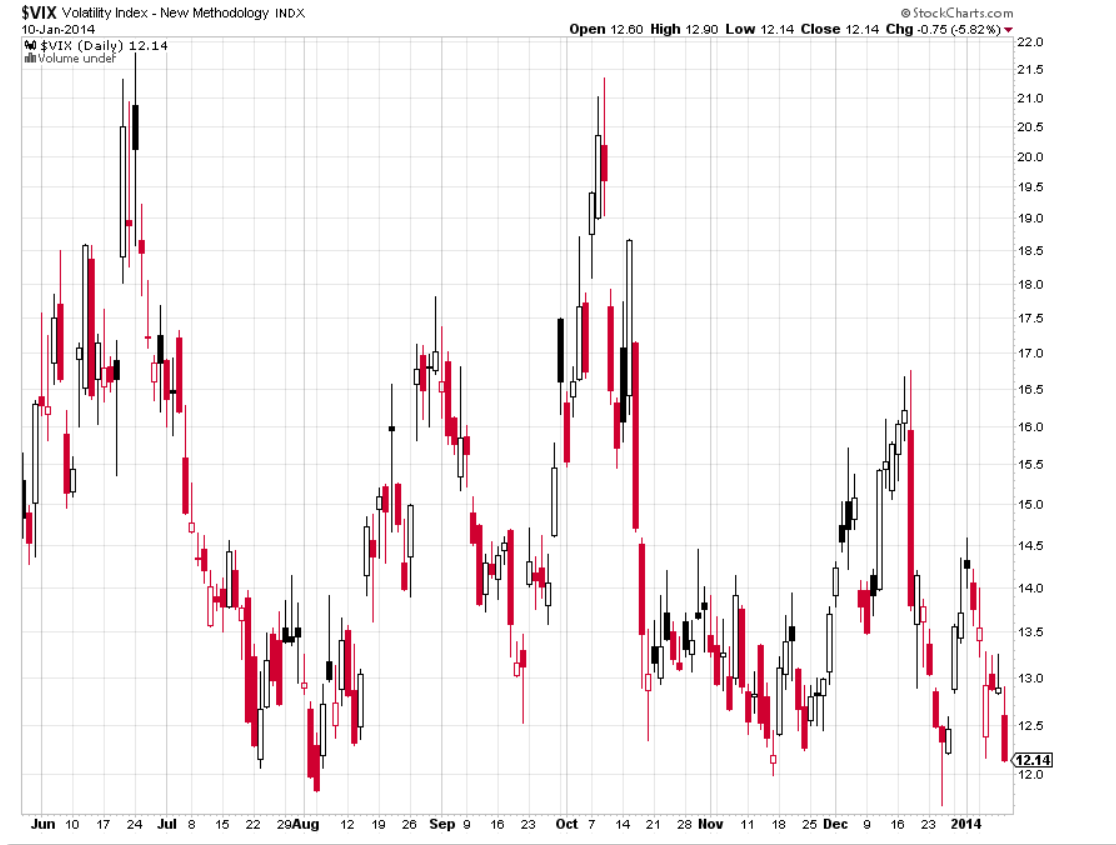
The volatility index traded down over 5% on Friday, typically you would see a spike up in volatility at or near an important market high. As of yet we have not seen anything remotely resembling that as the VIX continues to trade in the low teens which is near it's historic lows.
So even though we remain under resistance levels there is not a lot of signs pointing to any sort of imminent and important market top at the moment.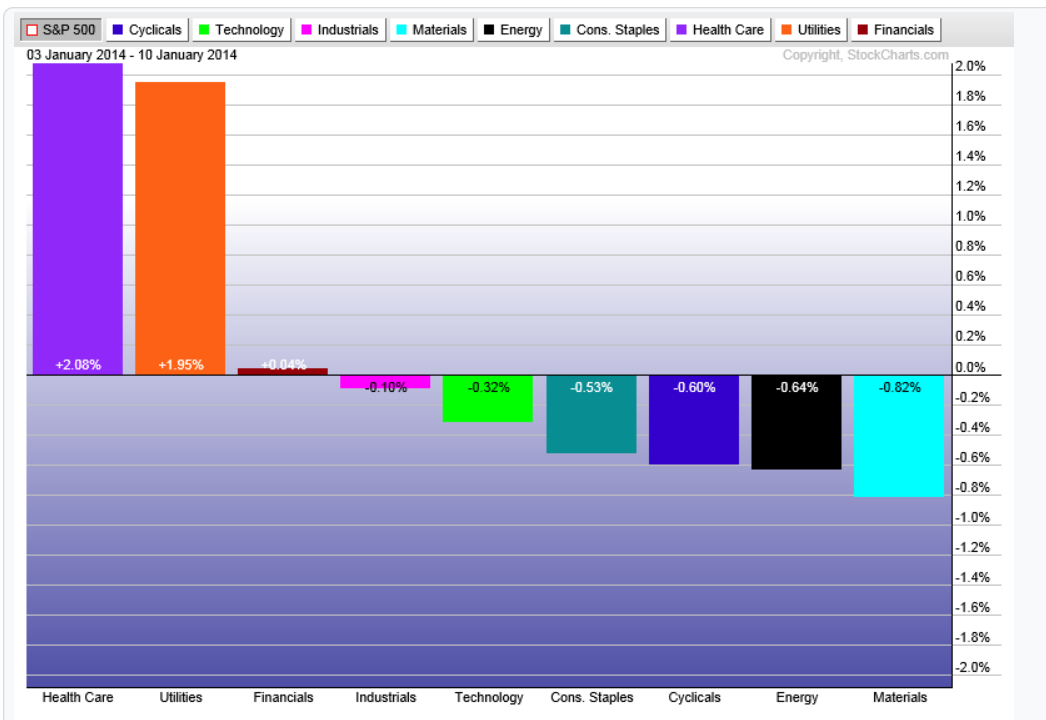
Sector performance for the week shows some risk aversion as Utilities show relative strength (long time since we have seen that) along with Health Care and Financials. The laggards this week came from the cyclical, energy and material sectors.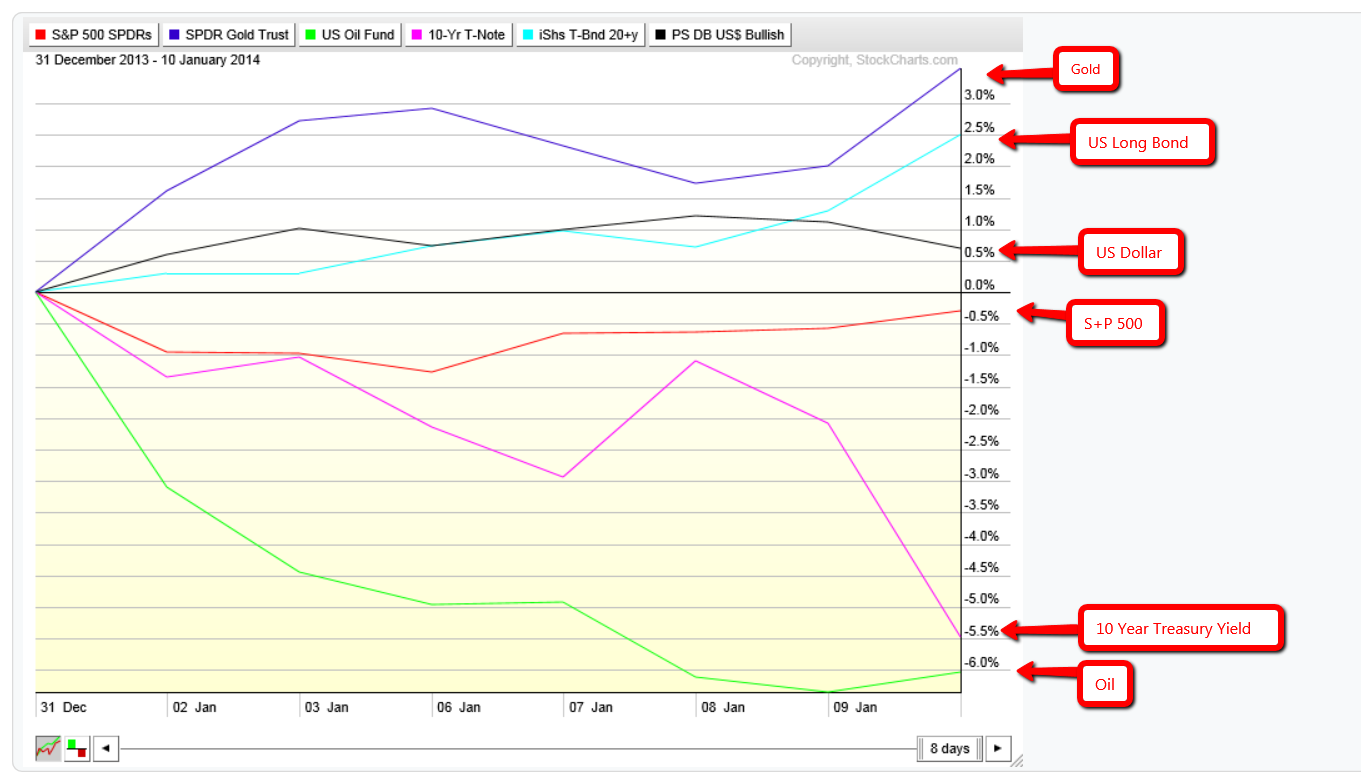
Taking a look at year to date performance by asset class, so far even though it's still early we can see a lean towards risk aversion to start the new year as Gold, Bonds and the Dollar are on top with year to date gains. And equities, yields and Oil are starting the year off in the red.
It's still far to early to read anything into this, but this is so far a much different start to the year compared to what we saw last year.
- English (UK)
- English (India)
- English (Canada)
- English (Australia)
- English (South Africa)
- English (Philippines)
- English (Nigeria)
- Deutsch
- Español (España)
- Español (México)
- Français
- Italiano
- Nederlands
- Português (Portugal)
- Polski
- Português (Brasil)
- Русский
- Türkçe
- العربية
- Ελληνικά
- Svenska
- Suomi
- עברית
- 日本語
- 한국어
- 简体中文
- 繁體中文
- Bahasa Indonesia
- Bahasa Melayu
- ไทย
- Tiếng Việt
- हिंदी
Weekly Stock Market Summary: Not Getting Bearish, Yet
Latest comments
Loading next article…
Install Our App
Risk Disclosure: Trading in financial instruments and/or cryptocurrencies involves high risks including the risk of losing some, or all, of your investment amount, and may not be suitable for all investors. Prices of cryptocurrencies are extremely volatile and may be affected by external factors such as financial, regulatory or political events. Trading on margin increases the financial risks.
Before deciding to trade in financial instrument or cryptocurrencies you should be fully informed of the risks and costs associated with trading the financial markets, carefully consider your investment objectives, level of experience, and risk appetite, and seek professional advice where needed.
Fusion Media would like to remind you that the data contained in this website is not necessarily real-time nor accurate. The data and prices on the website are not necessarily provided by any market or exchange, but may be provided by market makers, and so prices may not be accurate and may differ from the actual price at any given market, meaning prices are indicative and not appropriate for trading purposes. Fusion Media and any provider of the data contained in this website will not accept liability for any loss or damage as a result of your trading, or your reliance on the information contained within this website.
It is prohibited to use, store, reproduce, display, modify, transmit or distribute the data contained in this website without the explicit prior written permission of Fusion Media and/or the data provider. All intellectual property rights are reserved by the providers and/or the exchange providing the data contained in this website.
Fusion Media may be compensated by the advertisers that appear on the website, based on your interaction with the advertisements or advertisers.
© 2007-2025 - Fusion Media Limited. All Rights Reserved.
