Investing.com’s stocks of the week
Options Expiration Ante Portas – Just as a Resistance Level is Reached
After we had penned our little missive on the breakout in gold stocks on Monday, it dawned on us that an options expiration takes place this week. Normally, gold stocks decline into the expiration date. Don’t hold us to this, but the last time we remember call writers being forced to delta-hedge their way out of trouble in gold and silver stocks right at the end of an expiration week was sometime in 2006.
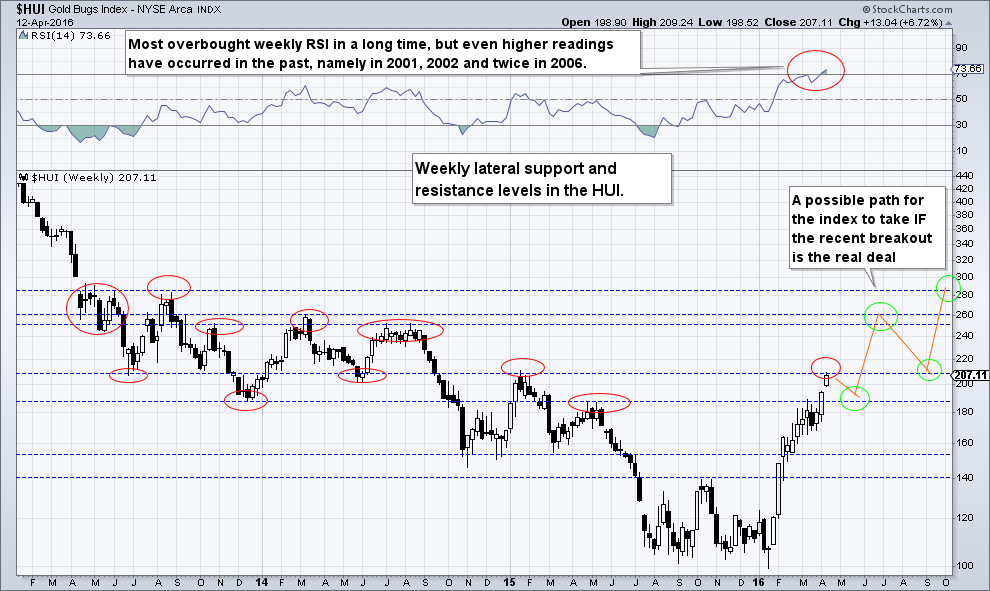
Given this backdrop and the recent breakout, we decided to take a look at weekly lateral resistance levels in the HUI – not least because by Monday’s close, it had actually reached one of those. Here is a chart showing all the important medium term support and resistance lines, plus a possible future path for the index if the breakout actually holds up (obviously, this path is pure guesswork).

Weekly resistance and support levels in the HUI. The weekly RSI hasn’t been this overbought since 2006, but this is actually a long-term bullish sign, if somewhat concerning in the short to medium term. The index has now reached the first major post breakout weekly resistance point, which is defined by the early 2015 high as well as two interim lows made in 2013 and 2014 (follow the red circles). To the right, we show what might happen if the breakout actually holds – click to enlarge.
As you can see from this chart, even if the rally continues in the relatively near term, it should be capped at around 250 – 260 points in the HUI at the latest. Thereafter, a lengthy consolidation will probably set in.
Alternatively, touching the 2015 resistance point may well already suffice to start such a correction. If so, we will have to wait and see what transpires, but our guess would be that the index would fall back into the recent congestion area in this case, and test or even undercut its 50-day moving average at a minimum (currently at approx. 168 points).
A Potential Warning Sign from XME
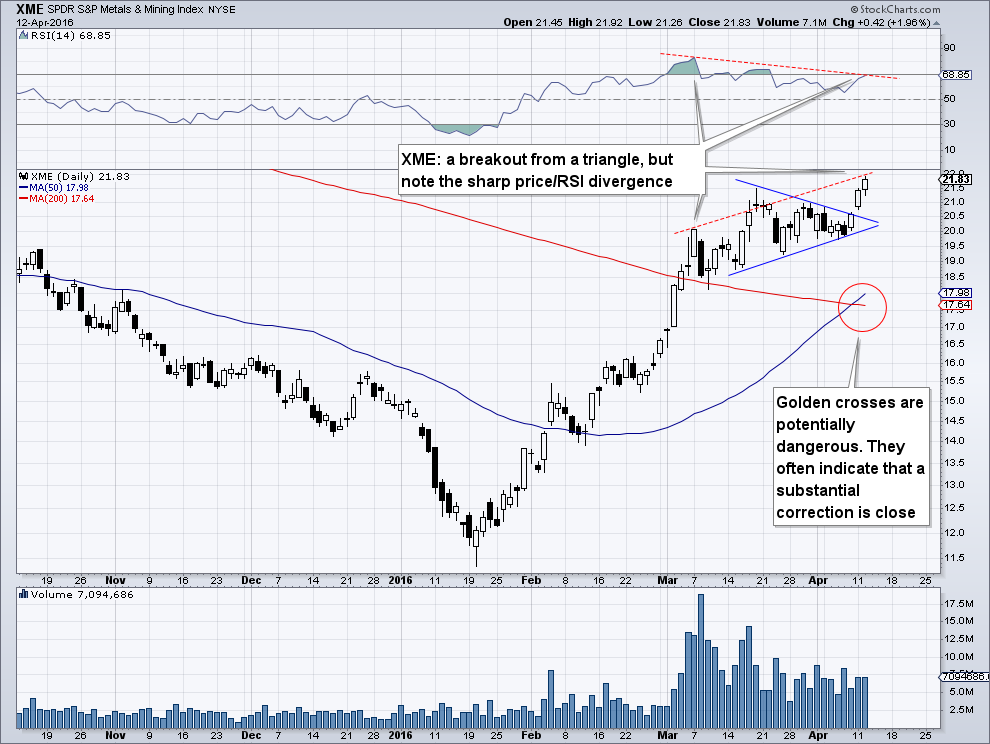
Below is a daily chart of SPDR S&P Metals & Mining (NYSE:XME), the industrial metals and mining ETF. As you can see here, it has recently broken out from a triangle, but the combination of a sharp price/RSI divergence with a so-called “golden cross” represents a short term warning sign in our opinion:

XME: a breakout from a trinagle, but accompanied by a strong price/RSI divergence and a “golden cross” – which is often a sign that a significant correction is fairly imminent .
Conclusion
We conclude that in the near to medium term, caution is increasingly warranted in the mining sector. This will be all the more true if the rally in mining shares continues in the near term, as in that case, the record high weekly RSI readings in the HUI seen in 2001, 2002 and 2006 will soon be touched again.
