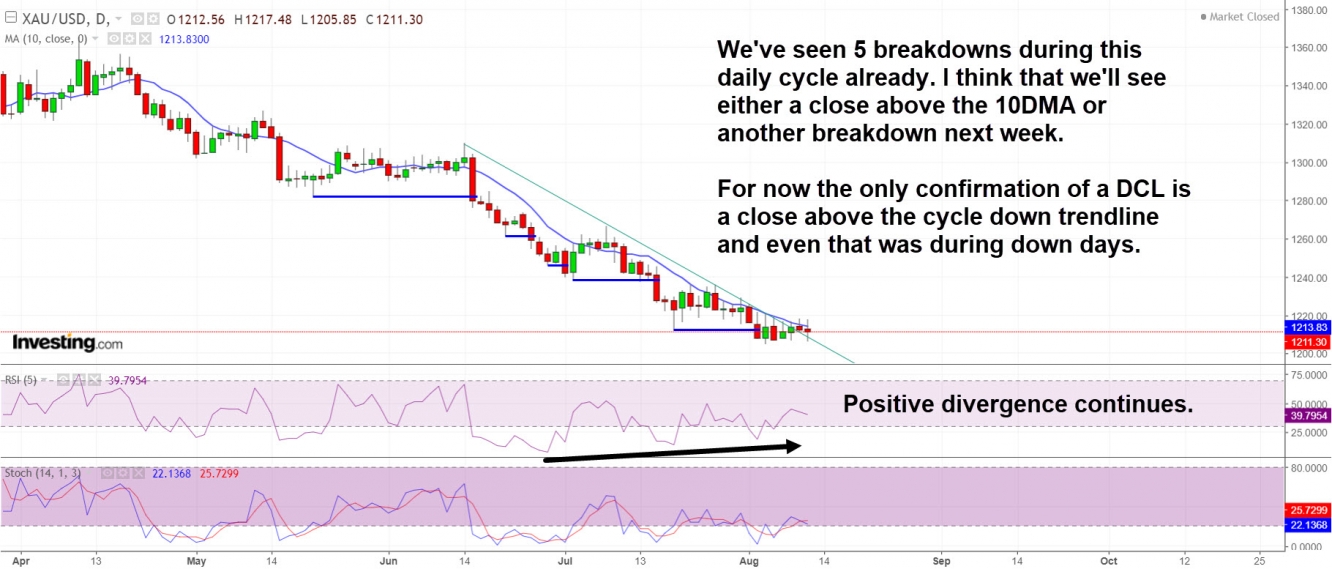
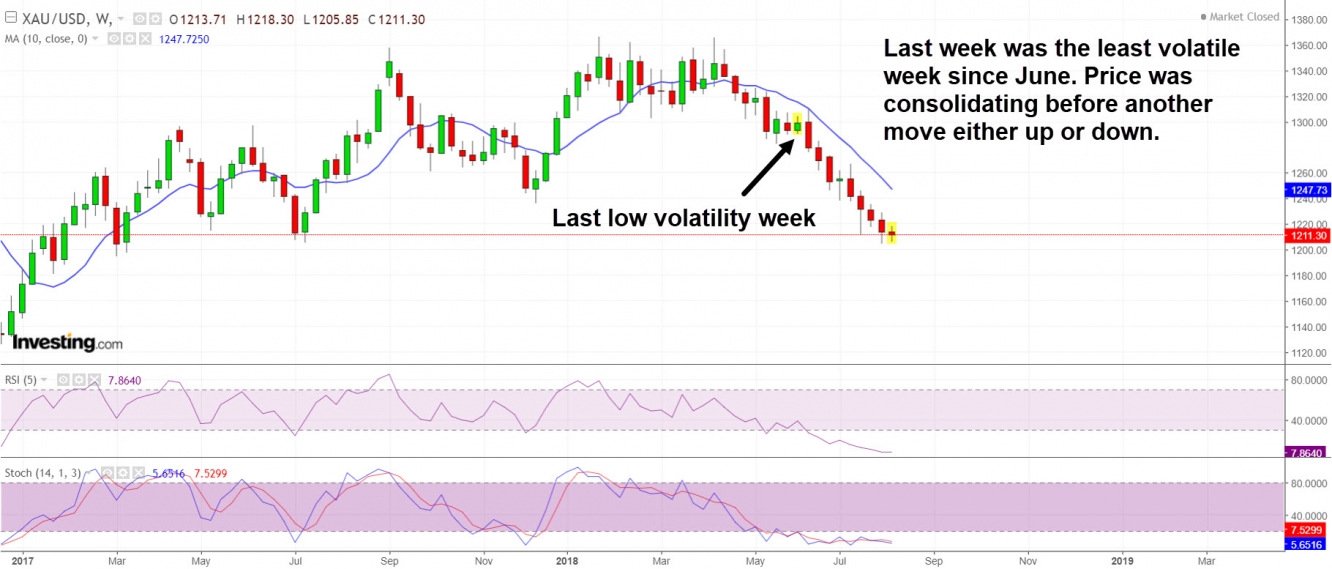
Slightly depending on which charting tools you're using, we have now closed twice above the daily cycle decline trend line in gold. The closes have been very mild, and we don't have any other confirmations of a completed DCL yet. I would say that we still lack guidance on whether the daily cycle has bottomed or if we are going to see another breakdown next week. We've seen 5 breakdowns during this last daily cycle and so I think it's just a coin flip whether we have our bottom in or not. What is positive, is that this week featured a slight character change in terms of the weekly candles. The current low occurred on day 54 which is right about what we would expect for a modern daily cycle to last. It is certain that we will see either a close above the 10 day moving average or a fresh lower low next week.
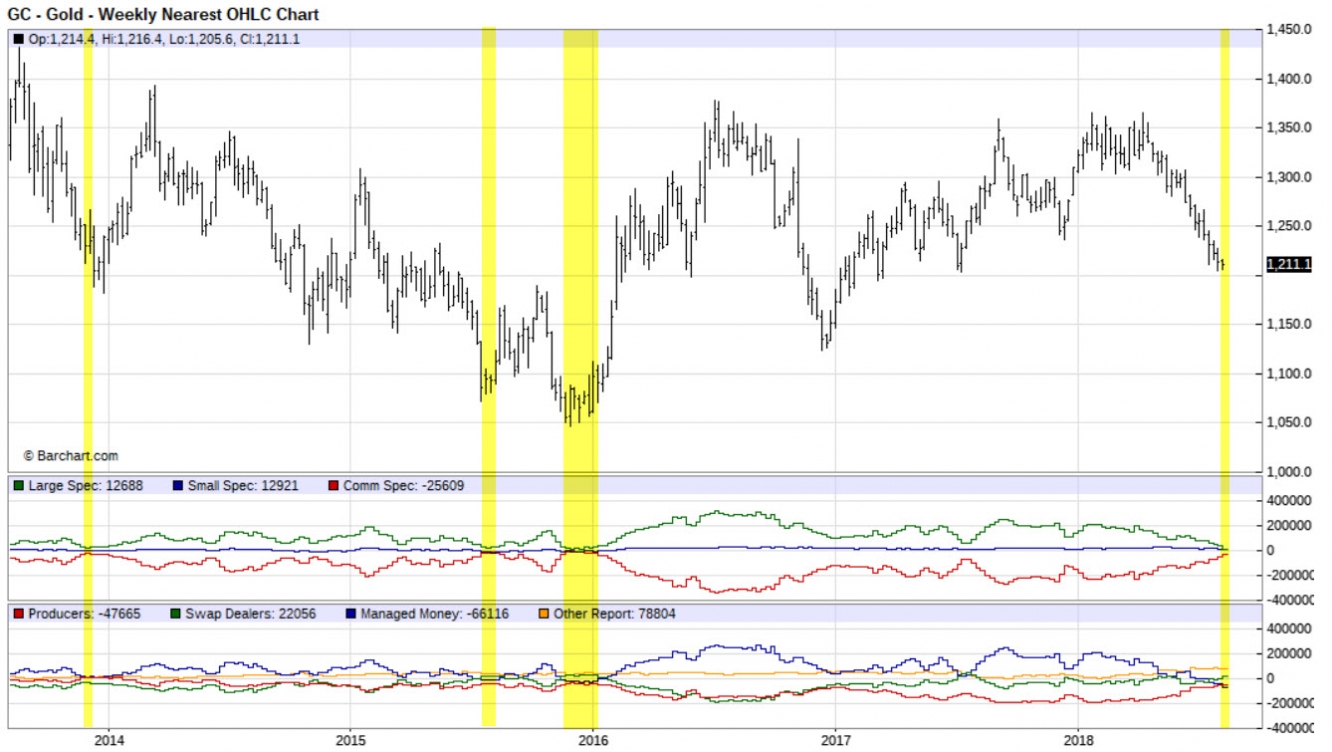
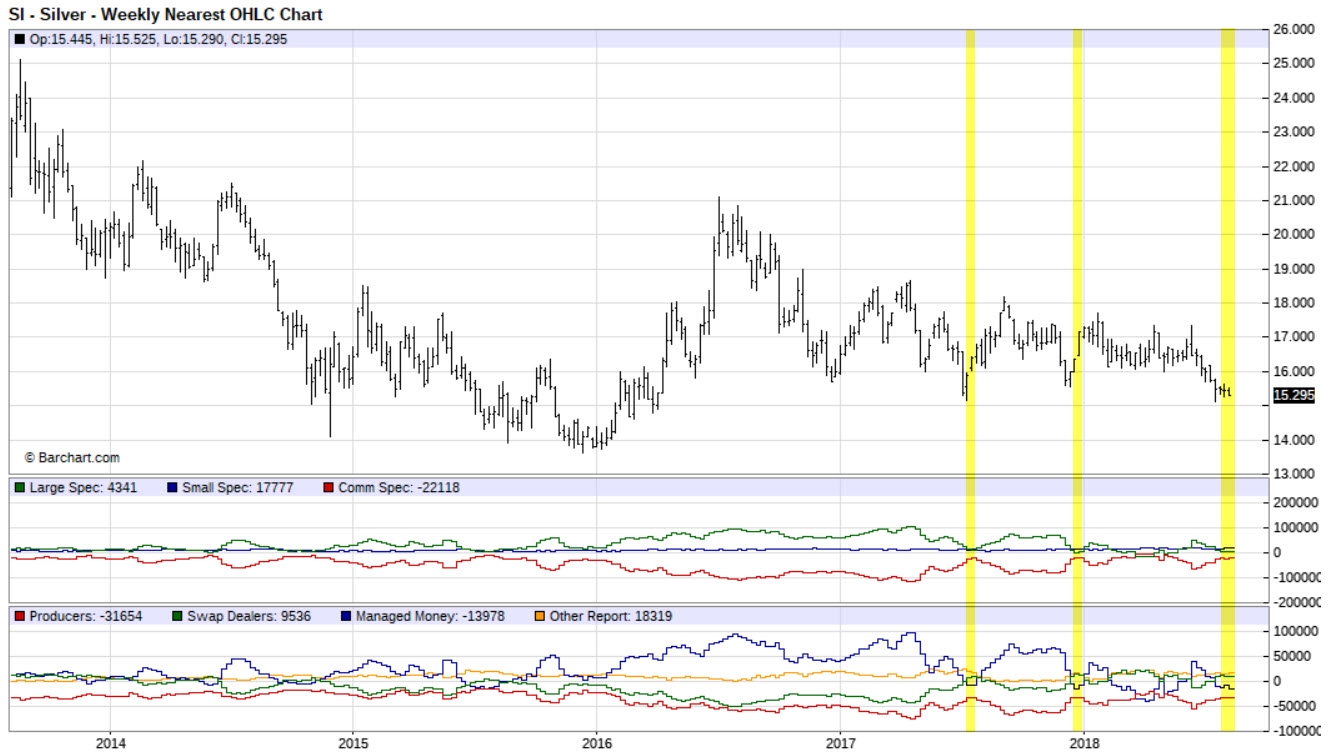
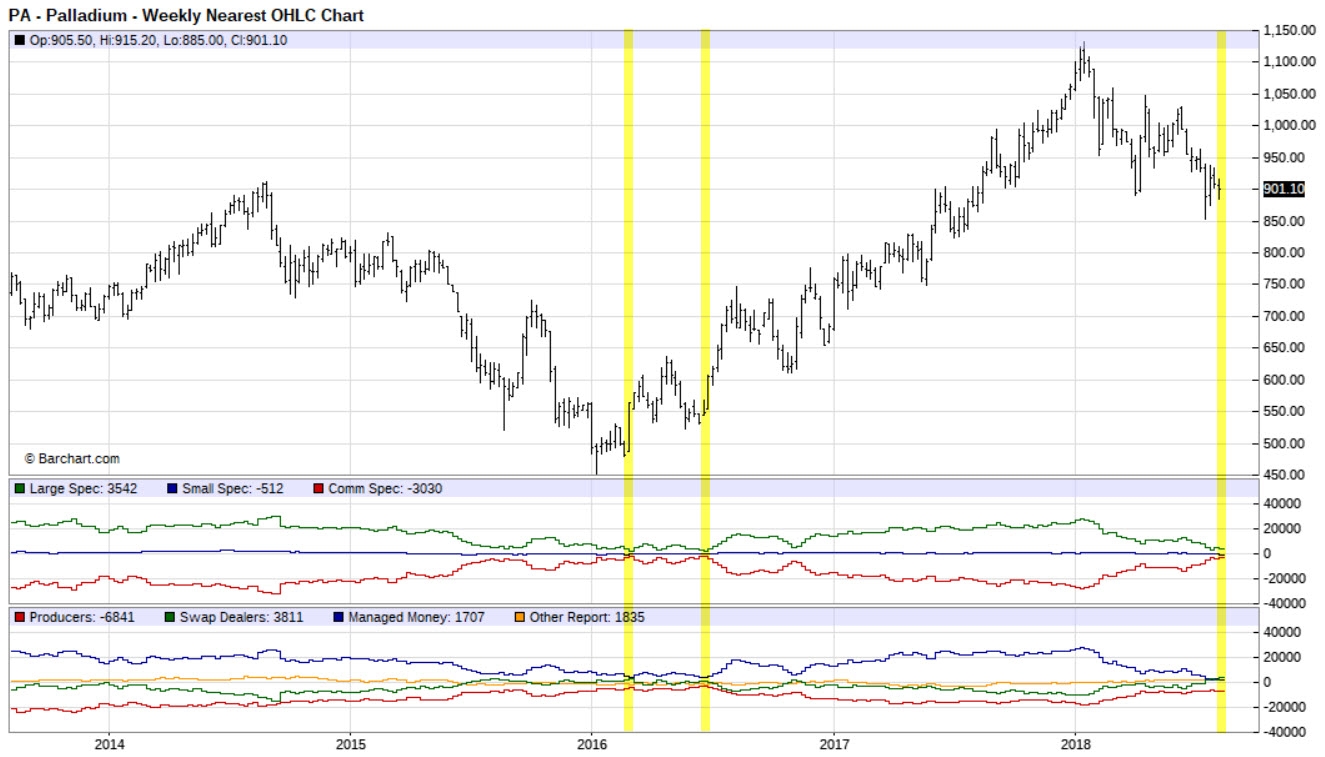
Last week I heard a theory that China would be behind the large speculators shorts. Since the large speculators continue to up their short bets, this could support the theory that the Chinese central bank is shorting gold in order to peg yuan to gold. Selling is becoming quite irrational at this point. I'm not completely buying the China theory for now and I'd like to see some action to the upside before saying for certain that China is on a new gold standard. For now, the XAU/CNY tight range is just another correlation which tend to break at some point. What does not support the theory that China is behind all the large spec shorts is that we have massive shorts in other precious metals as well.
Source: Barcharts.com
CFTC Silver speculative net positions
Source: Barcharts.com
Source: Barcharts.com
Source: Barcharts.com
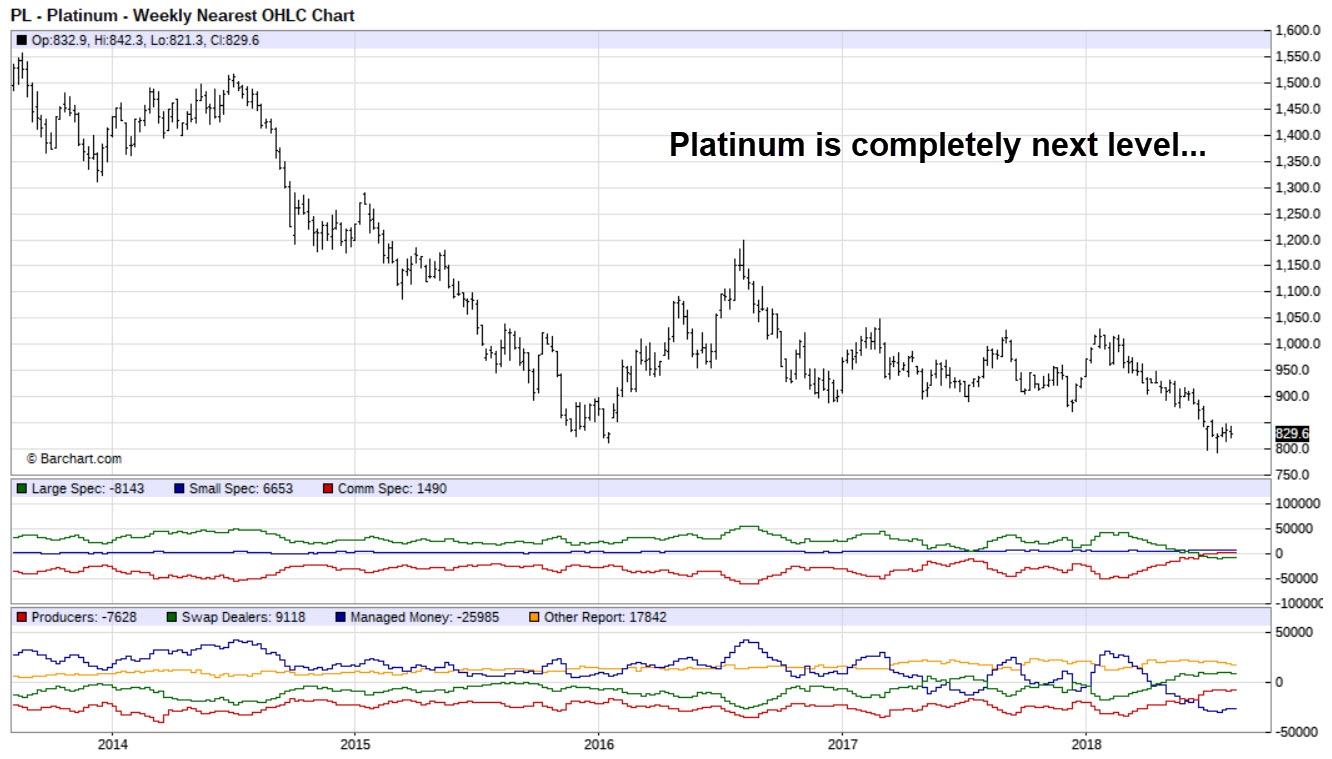
Gold was basically flat the whole week and yet we gained lots of new shorts. We are currently close to all time records in the precious metals COT numbers across the board. If the short sellers are just hedge funds and retail trend followers (like we can presume for now), they will have to buy the borrowed contract back at some point. What we are missing for now is technical buy signals. Once we get a close above the 10DMA, oscillators start to move up from oversold conditions and we get maybe a weekly swing low, technical traders will start buying. Considering the extremely oversold conditions, I think that we are going to see lots of buying once we get some positive signals. Believe me, 34 weeks into an intermediate cycle, we are going to see a bottom in gold rather sooner than later if we don't have it already. There are plenty of shorts to cover once price starts to move up and that's why I tend to think that we are setting up for a massive short squeeze across the board in the precious metals.
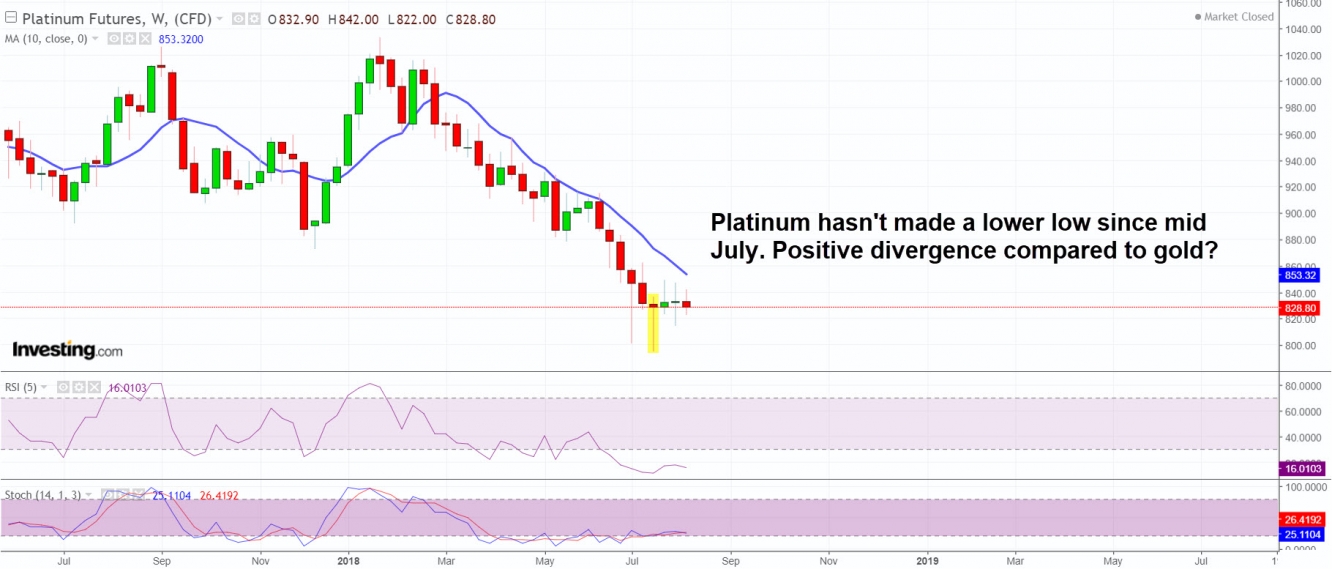
If you look at the weekly chart of platinum, you can see that platinum has been diverging from gold for 3 weeks already.
I am personally not ready to trash the gold bull yet and we need to see what the next intermediate rally brings. As we can see from the COT reports, commercials, aka smart money, is either long or just slightly short precious metals. In common sense, the current setup is ideal for a contrarian trade and for the time being, I give good odds for a short squeeze in the months ahead.
Currencies
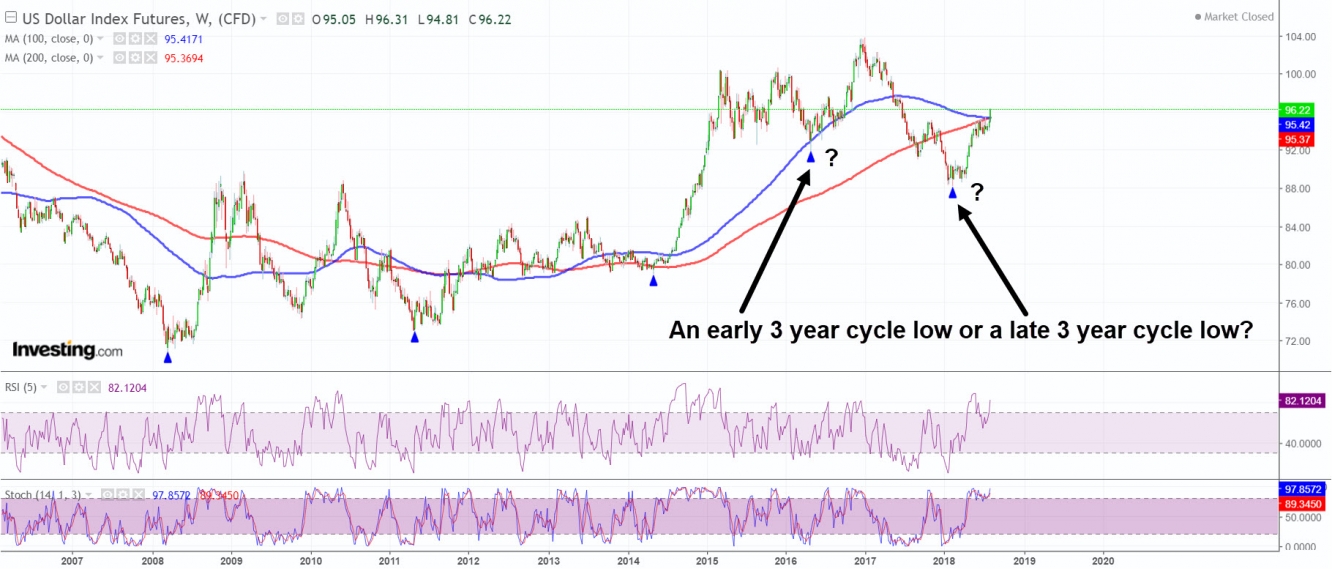
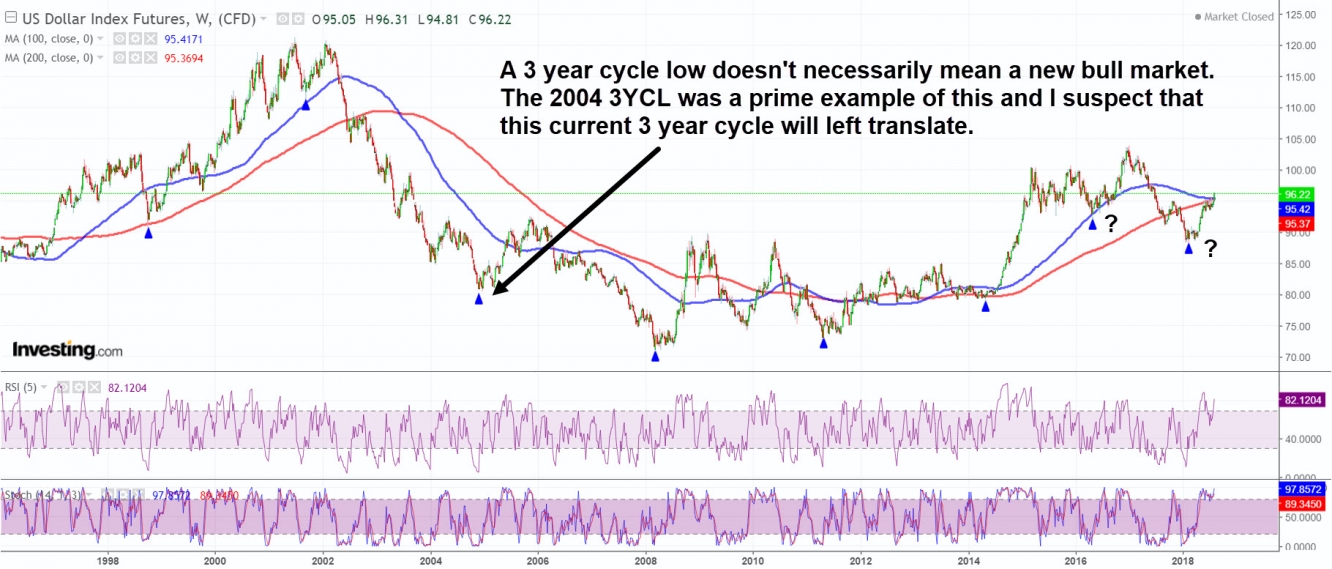
The pop above both the 100 and the 200 week moving averages in dollar was a powerful show of strength and to be honest I wasn't expecting such a move. The close on Friday got me thinking, whether the 3 year cycle low in the dollar occurred in February. This would explain the exceptional strength in the dollar.
The bigger picture remains the same. The dollar remains in a secular bear market, and so I think that the dollar will at some point roll over and deliver a lower low. This, however, has probably been pushed to 2019 contrary to what I've been looking for at the end of 2018. Now that it's possible that we got the 3 year cycle low in February, let's take a look at what 3 year cycle lows have produced in the past.
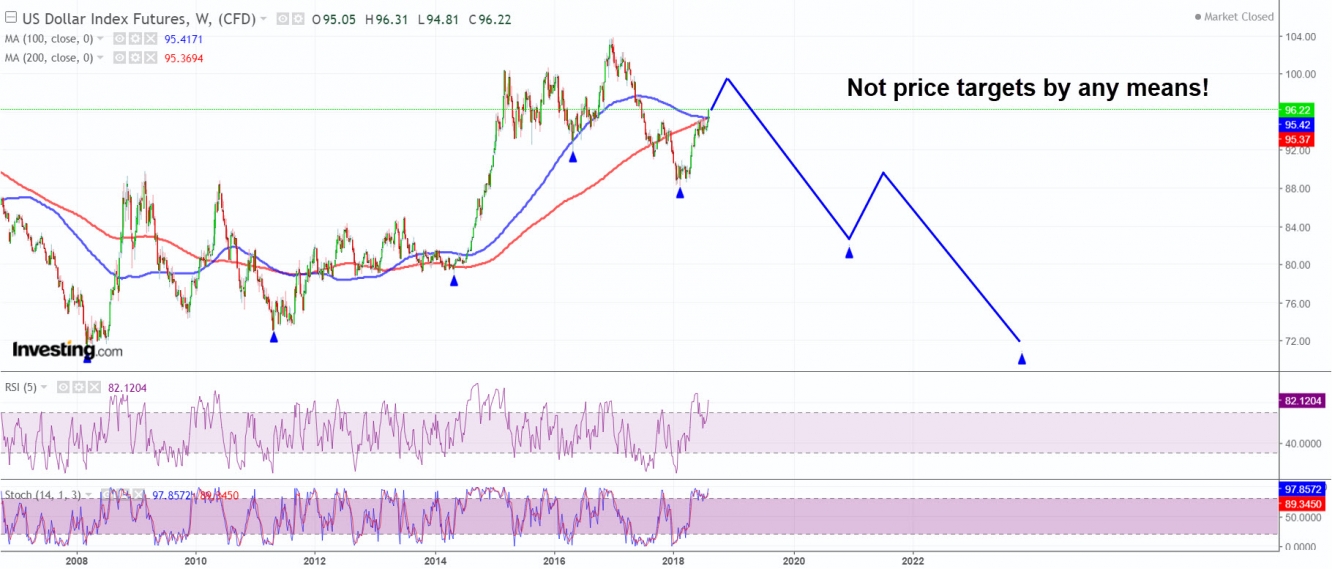
Even though there have been some powerful rallies out of there 3 year cycle lows, I still think that the dollar remains in a bear market and that the current 3 year cycle will roll over to deliver a left translated cycle. The 2004 multi year cycle low produced almost a 15% rally, but yet it still rolled over to the 2008 bear market bottom. I think that the dollar bear market has at least another 3 year cycle low ahead before the bear is complete and I wouldn't be surprised if we would still have 6 years before a final bear market bottom.
If we had the 3 year cycle low in February, the next multi year cycle low in the dollar is due approx. 2021. I think that that cycle could also left translate and so the final bear market bottom is probably due somewhere between 2023 and 2025.
I find it almost hilarious that once the ECB announced that they're worried about some of the European banks having large exposure to Turkey, the euro plunged, and the dollar rallied. Seriously folks, if some European banks are in serious trouble due to the situation in Turkey, that puts all of the world's banks in just as bad a situation. The OTC bank to bank derivatives structure is so densely overlapped, that once you pull out a single Malaysia bank from the equation, all the banks in Sweden and Germany could potentially collapse in just a matter of days. If a major bank in Turkey fail, that will probably cause some European and Asian banks to fail, which will lead to more banks failing all over the world. Risk materializes quickly. It's foolish to think that if things go haywire in Europe that that wouldn't mean a global financial meltdown including the US.
Back to the cycles.
Once Friday progressed, it became apparent to me that the euro wasn't going to just deliver an intraday undercut to the June low and so I exited most of my euro longs which I had opened on Friday morning. I tend to think that for the euro to print a bottom, we'll need something called an event trigger. Event triggers are usually some breaking news which trigger enough buying to produce a bottom or enough selling to produce a top. The intermediate cycle is extremely long in both the euro and the dollar and so the euros cycle could bottom any day. I think that things are getting way out of control in the FX market as prices move quickly and volatility is plentiful. Any positive piece of news could be enough to flip momentum 180 degrees. For now, I'm just going to wait for a weekly swing in euro to get long. In times like these, I feel pretty safe since I hold most of my wealth in gold. Even though Comex price for gold is down 11% from January, if the whole banking sector will fail, that price becomes irrelevant. Not something we want to see but something that could well happen.
Oil
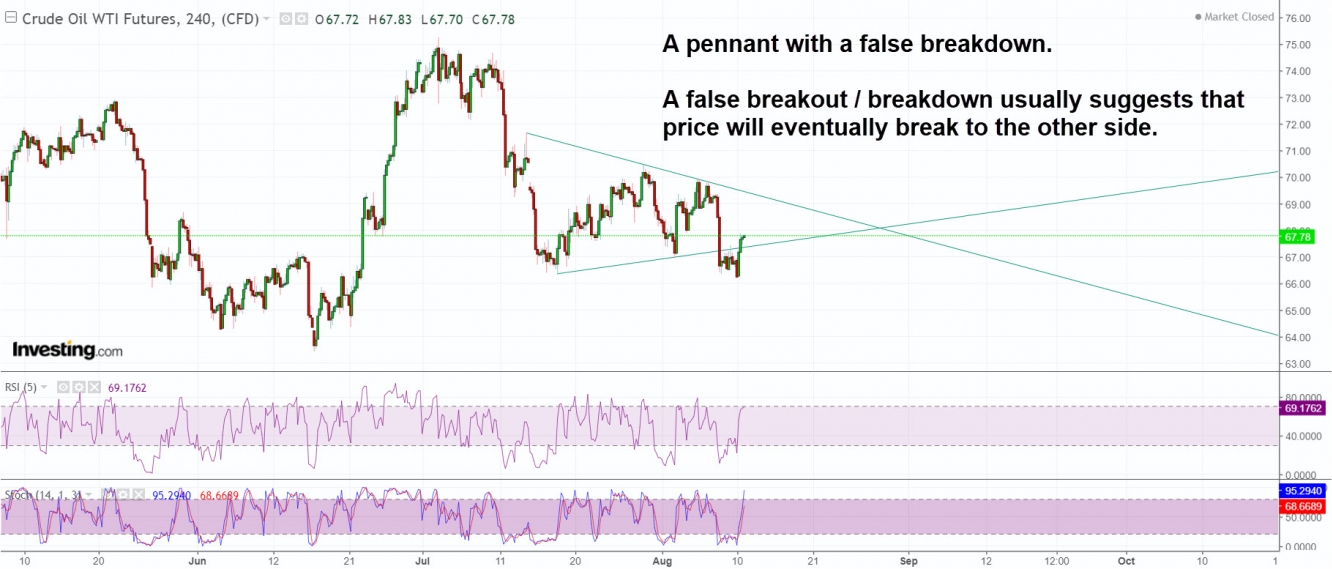
Oil provided a false breakout of a pennant which it's been forming for the past four weeks. It's possible that we produced a daily cycle low on Friday, but I wouldn't bet the farm on it. In theory, oil should produce a failed daily cycle to confirm an ICL and so oil should break down below the June low at about $63,60 but since we haven't had a true ICL in over a year now in oil, it could just be that we won't get a normal correction this time either. In 2017, stocks didn't produce a single failed daily cycle, yet we should have ICLs once or twice every year.
If the US economy is really slowing down like many more or less mainstream analyst houses are saying, we could be setting up for a recession later this year or early next year in the US. This is why I bought some out of the money crude oil call options a few weeks back. Recessions and bear markets in stocks require a catalyst to begin. For recessions, this catalyst has been since the 70s a 100% gain in oil prices in a year or less. Currently if you look at how much oil has risen in a year or less it's "only" up about 48%. This means that we have plenty of upside left, if we are to see a recession in the US later this year. During the June high, oil was up over 70% YoY.
Just like with gold, we need to take it day by day for now in oil. I've placed my bets and will not make direct trades with oil as cycles and sentiment haven't been working that well with oil during the past year. That being said, I'll still keep monitoring oil daily.
To receive instant notifications on new posts, follow SKAL Capital on Twitter.

