Weekly Price Action Summary – 10th to 15th Feb 2019
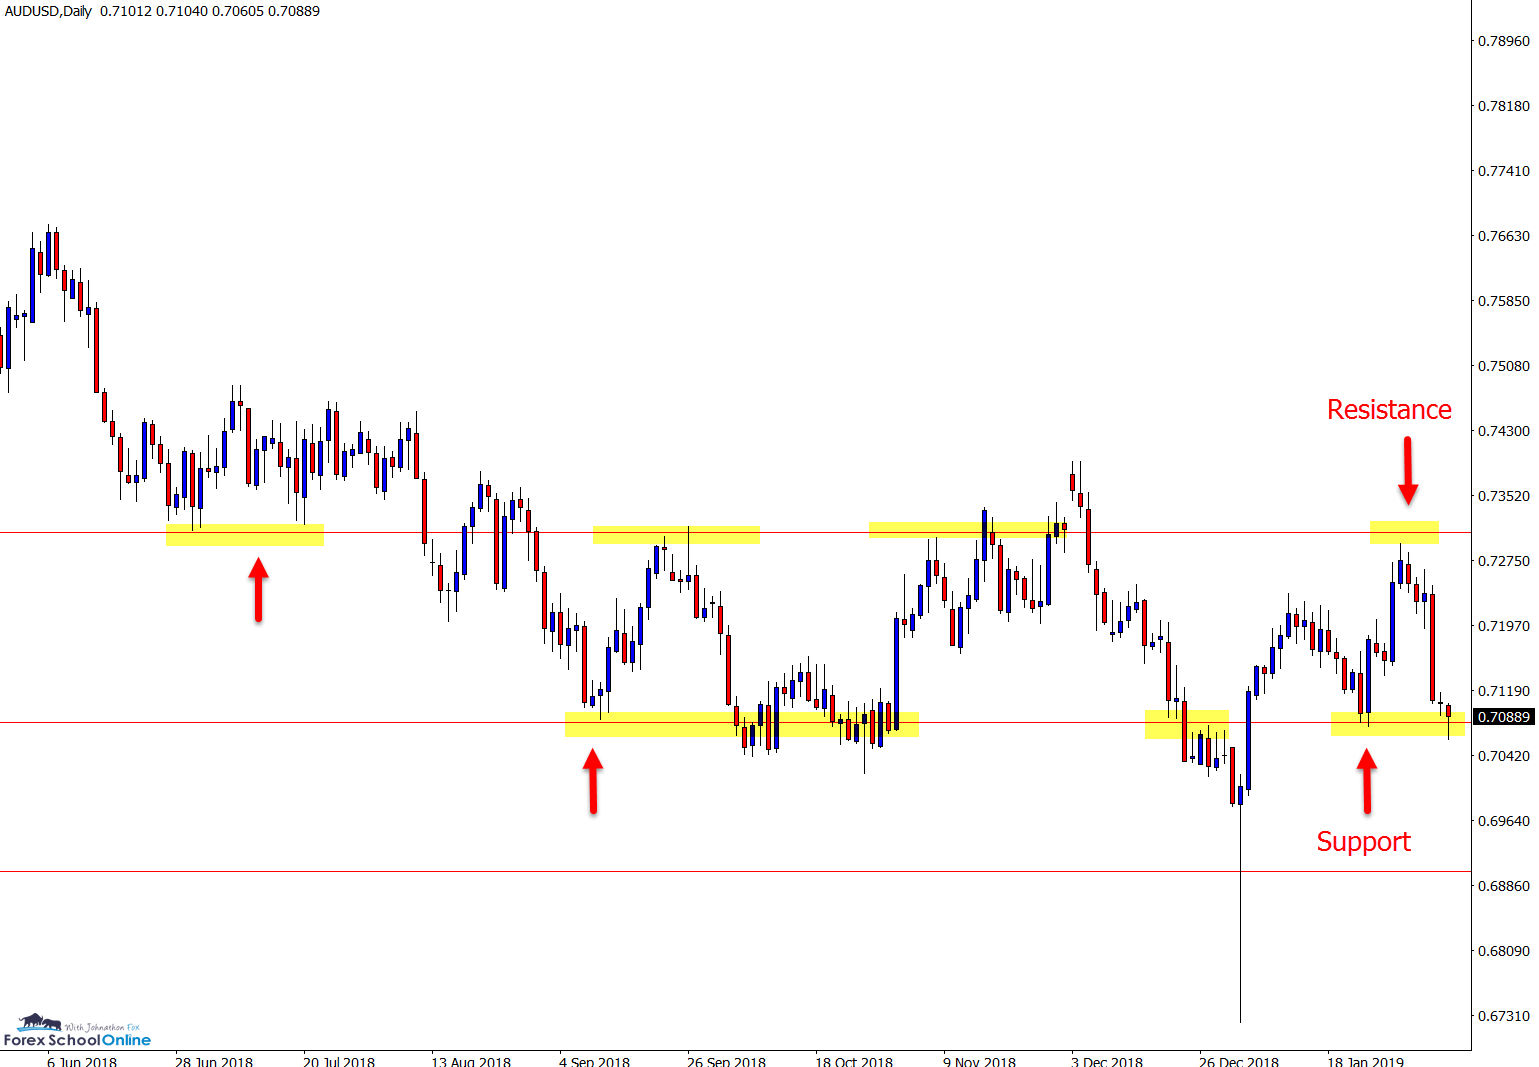
AUD/USD Daily Chart: Huge Sell Off From Daily Resistance
Price action on the Aussie this week saw price make a huge sell-off, rejecting the daily resistance level and moving back into the six-month range.
Price has been moving in a sideways ranging box and whipping between the support low and resistance high. As the chart shows below; there is also a midway point for this range making it tricky trading anywhere within this box. If price can continue with this move lower and break the support level, then we could see a lot more trade opportunities open up, such as breakouts and breakout and quick re-test setups.
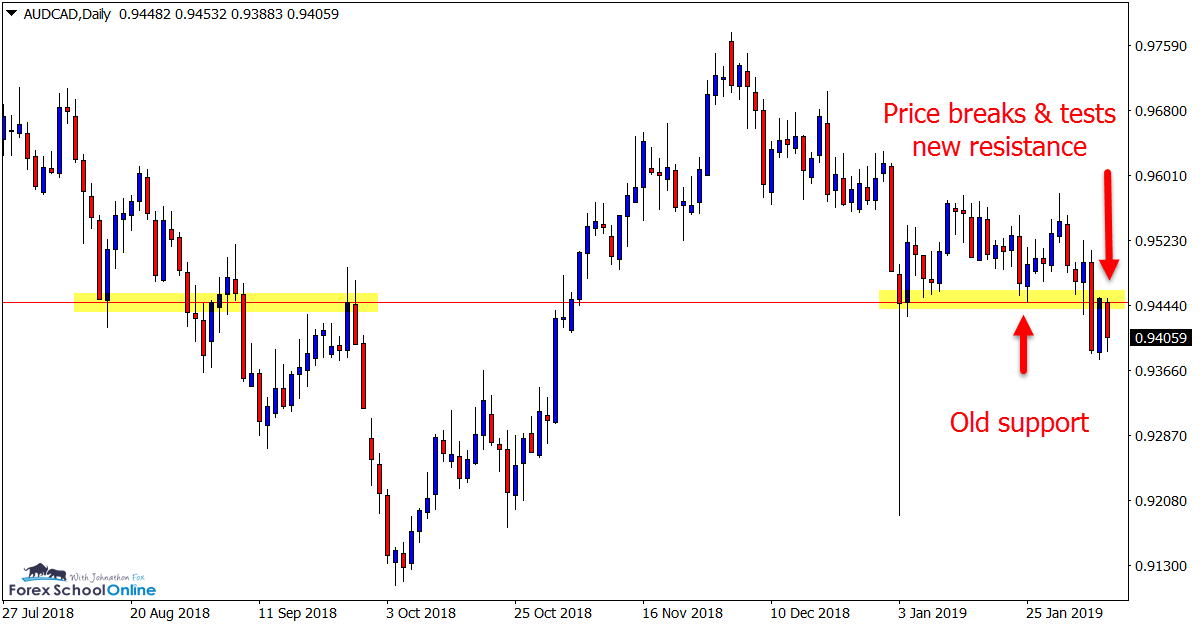
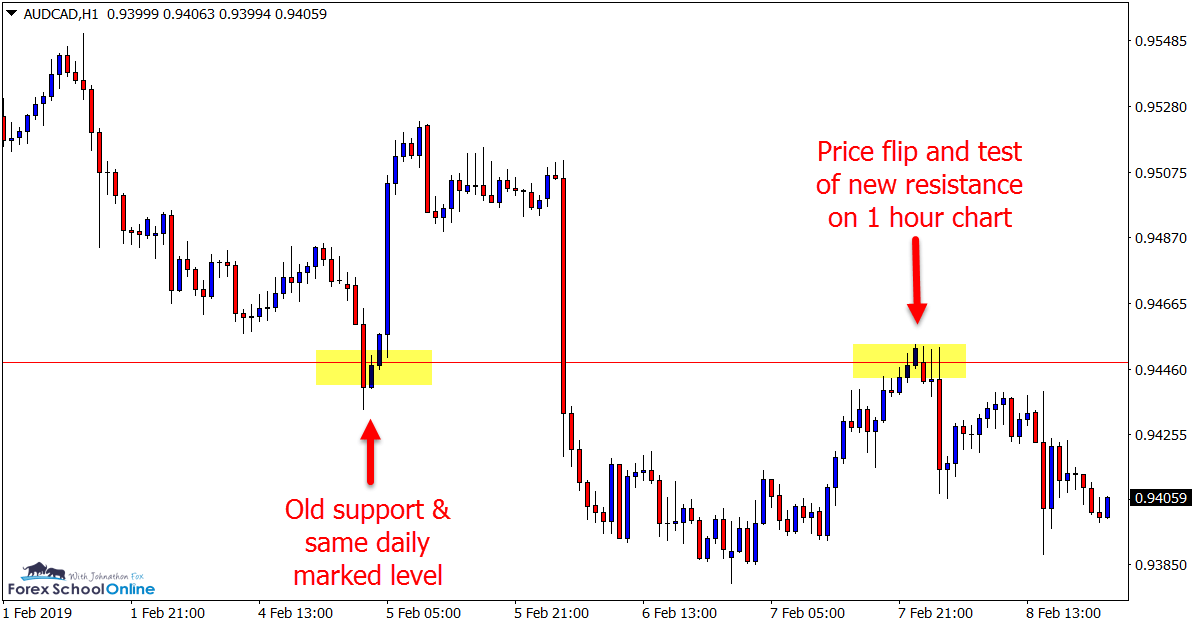
An example of the sort of price action traders could look for forming on the AUD/CAD this week with price breaking lower through the daily chart and then quickly snapping back into the old support and new resistance level.
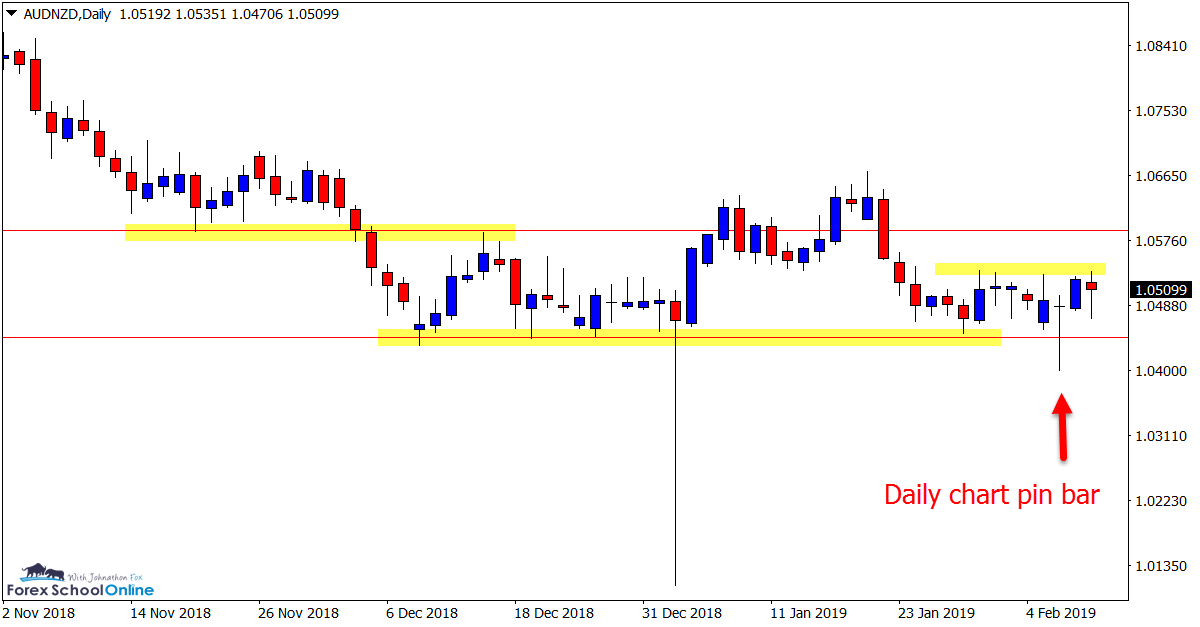
AUD/NZD Daily Chart Pin Bar at Support
In our recent charts in focus, we discussed this market and the major support level that price was looking to test on the daily chart.
Price this week moved into the support level and fired off a pin bar reversal. Whilst price has moved higher, it was stopped at the trouble area and the area that price had acted previously as a minor price flip. For the price to continue the move higher and back into the major highs of the resistance, we would need to see a clean break of this flip and trouble area.
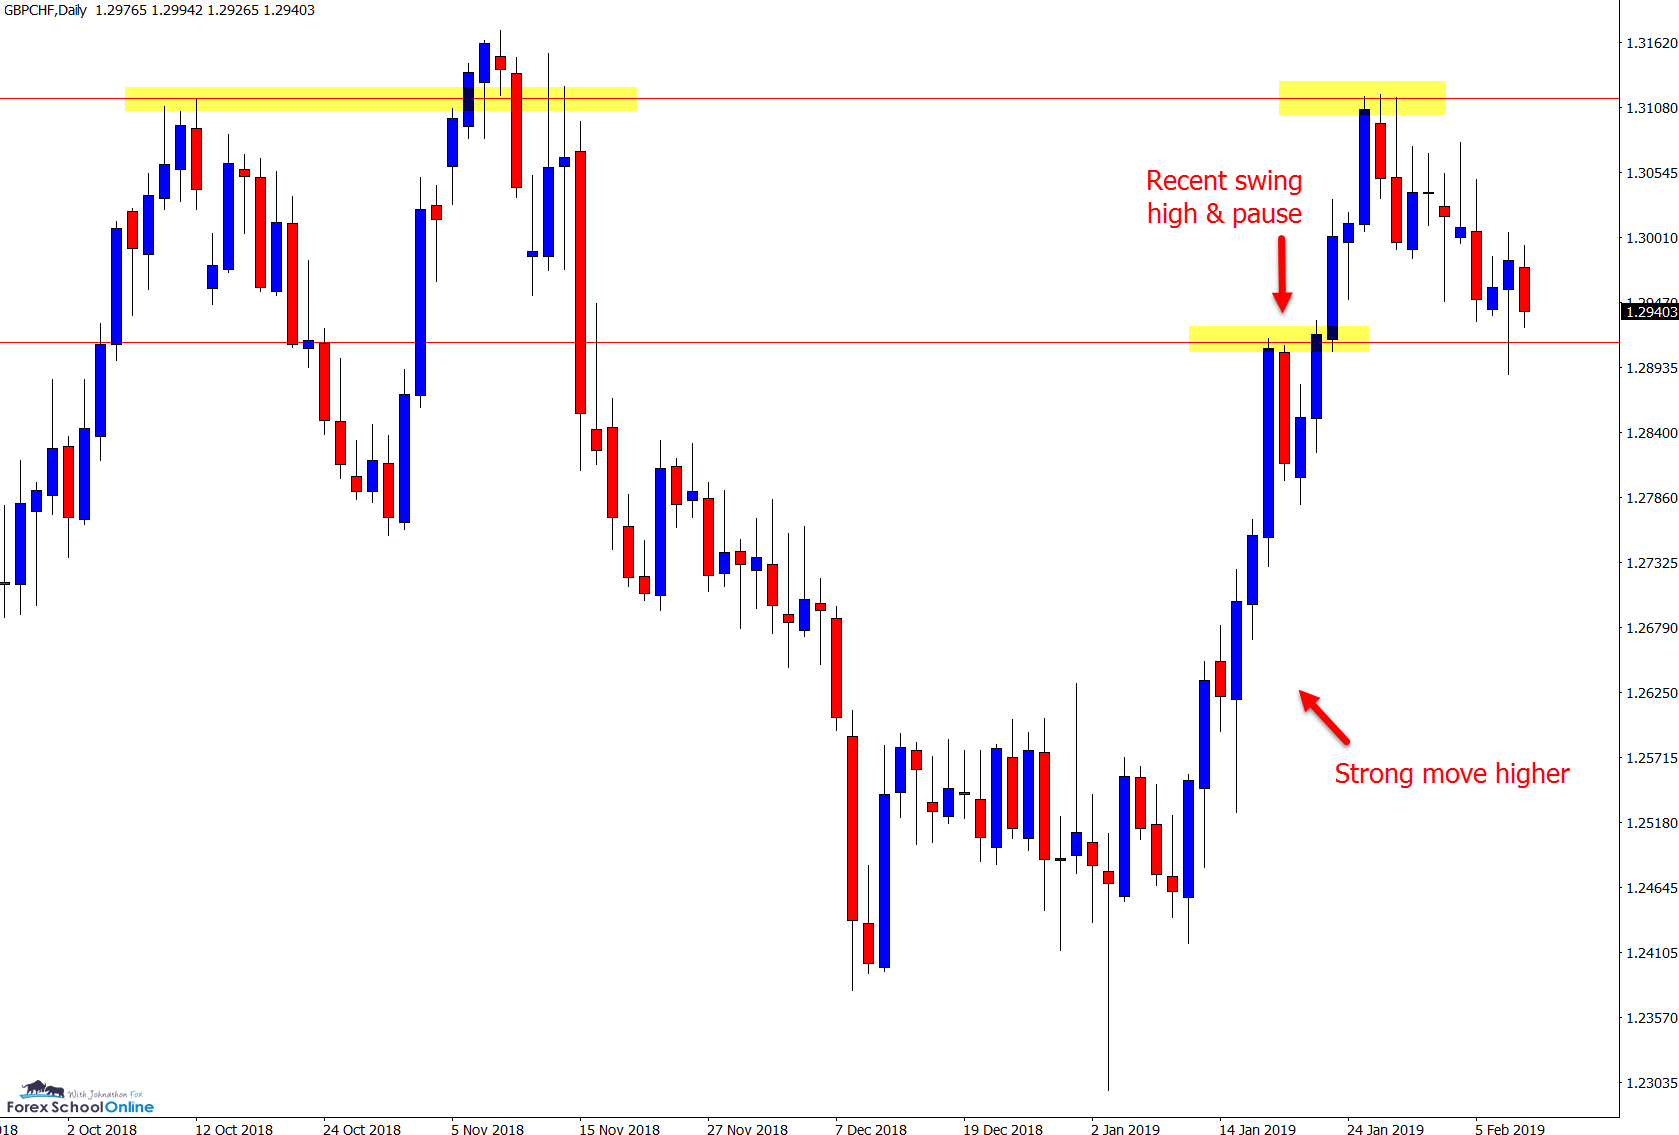
GBP/CHF Daily Chart: Strong Move Higher Faces Test
Price had been making a super aggressive push higher on the daily price action chart in this pair before running into the longer-term resistance level. Price has since pulled back into a recent swing point.
This was also the last area price found resistance in the move higher. This level looks crucial to where price wants to move next. If the smallish Bullish Engulfing Bar = BUEB that has formed on the daily chart can break higher and gain momentum, then we could see a move into the highs and to make another test at breaking out. A break lower and the level could quickly flip from support into resistance.
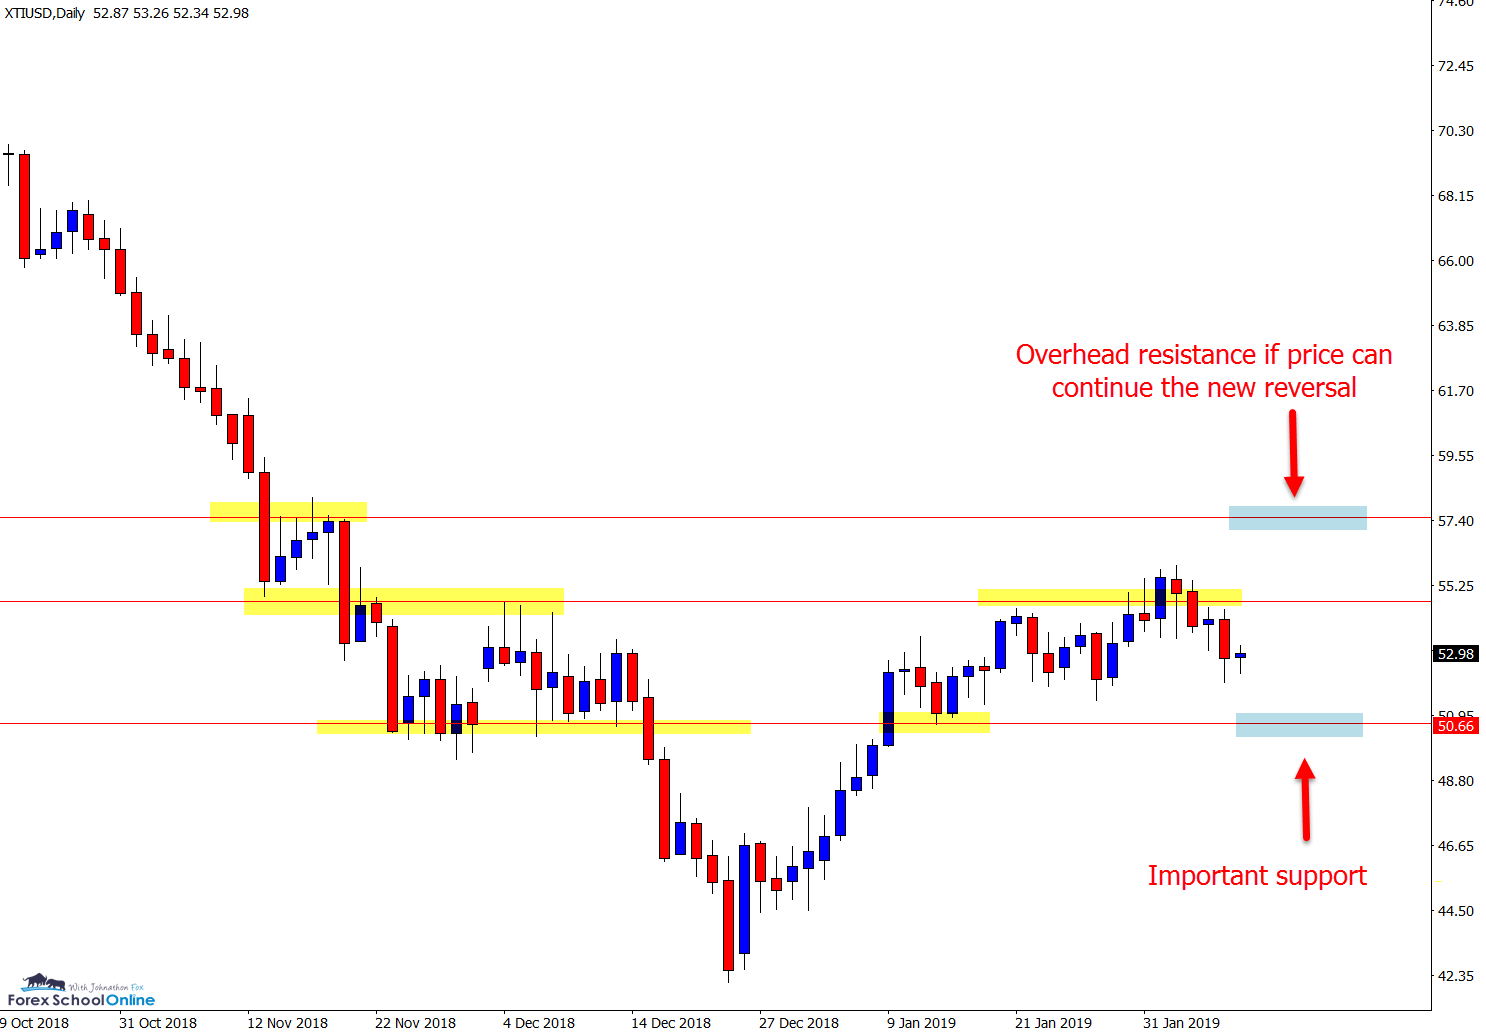
Oil Versus USD Daily Chart: Watching for Potential Market Reversal
Whilst this market got smashed lower all through the back half of 2018, at the start of 2019 it has been slowly attempting a price action reversal.
We can see on the daily chart that price has not only pushed off the extreme lows but also formed consecutive higher highs. The daily chart resistance price has recently rejected looks to be crucial. For the price to form a new market trend higher a solid break and move above this level will need to occur.
Disclaimer: All views, discussions and posts in the here are the view of Forex School Online and are not recommendations or trading advice. All posts are general in nature and are not advice to buy or sell.
