Oil: Bullish Breakout Holding; GBP/USD: Inside Bar At Key Support Zone

Published 05/04/2015, 04:54 AM
Updated 05/14/2017, 06:45 AM
GBP/USD
-
CL
-

GBP/USD – Inside Bar At Key Support Zone (4hr chart)
Forming a double top and failing at the ‘big figure‘ of 1.55 last week, the Cable got murdered to end the week, dropping 4 handles in a couple of days.

The pair then formed and inside bar at a key support zone, suggesting some mild profit taking to end the week, but no real presence of strength by the bulls.

The key support zone for the pair ST comes in at 1.5115 – 1.5065. A break below this zone opens an attack on 1.4863 so lots of potential upside remains.

Unless that large bar at the end of the move was exhaustion price action selling, then I’m suspecting another leg down after a small pullback. Only a strong impulsive bounce here changes my ST bearish bias.
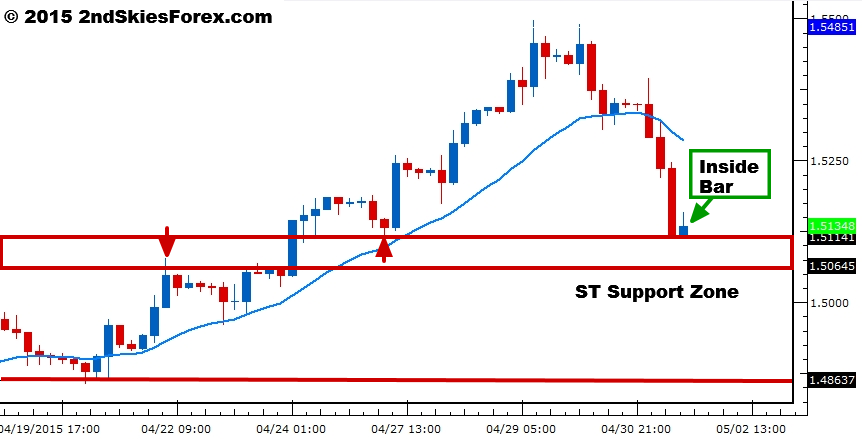
GBP/USD 4 Hour Chart
WTI Oil – Bullish Breakout Holding (4hr chart)
Last week we talked about the ST corrective phase in WTI between 58.20 and 55.75 as being a bullish sign with a likely breakout and breakout pullback on the cards.

As you an see from the chart below, this is exactly what happened with an upside breakout pulling right back to the 58.20 level before bouncing higher.

Some members profited from this so congrats to those who did. For now, ST & MT we have a bullish bias while above 58.20 and 55.75 on a daily closing basis. Beyond 60, I’m not seeing much resistance till about 64 and 73.
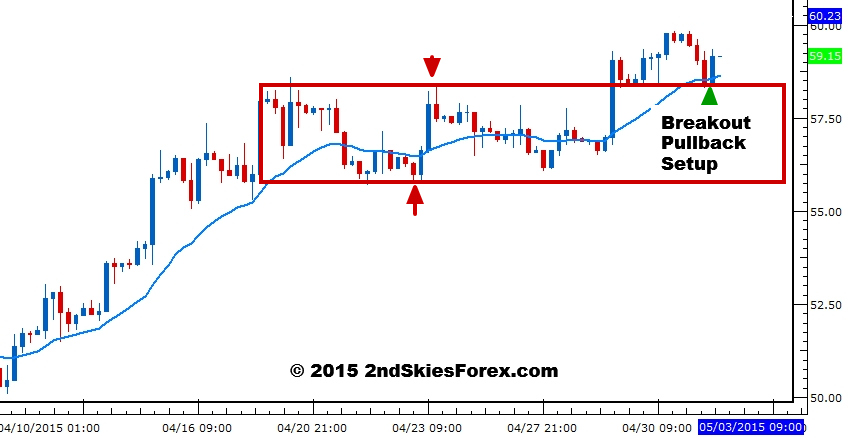
Crude Oil 4 Hour Chart

Original post

Latest comments

Loading next article…
Risk Disclosure: Trading in financial instruments and/or cryptocurrencies involves high risks including the risk of losing some, or all, of your investment amount, and may not be suitable for all investors. Prices of cryptocurrencies are extremely volatile and may be affected by external factors such as financial, regulatory or political events. Trading on margin increases the financial risks.
Before deciding to trade in financial instrument or cryptocurrencies you should be fully informed of the risks and costs associated with trading the financial markets, carefully consider your investment objectives, level of experience, and risk appetite, and seek professional advice where needed.
Fusion Media would like to remind you that the data contained in this website is not necessarily real-time nor accurate. The data and prices on the website are not necessarily provided by any market or exchange, but may be provided by market makers, and so prices may not be accurate and may differ from the actual price at any given market, meaning prices are indicative and not appropriate for trading purposes. Fusion Media and any provider of the data contained in this website will not accept liability for any loss or damage as a result of your trading, or your reliance on the information contained within this website.
It is prohibited to use, store, reproduce, display, modify, transmit or distribute the data contained in this website without the explicit prior written permission of Fusion Media and/or the data provider. All intellectual property rights are reserved by the providers and/or the exchange providing the data contained in this website.
Fusion Media may be compensated by the advertisers that appear on the website, based on your interaction with the advertisements or advertisers.
© 2007-2025 - Fusion Media Limited. All Rights Reserved.