For the first time this year, the euro has gained for 6 of the last 7 weeks. Another first since May of this year, the pair formed a strong breakout bar taking out the weekly 20ema. The latter will likely bring in new technical longs on the break and I only see minor resistance ahead up till the big figure at 1.3000.
Bulls can look for longs on pullbacks to former resistance at 1.2650, now support. More aggressive intraday players can look for price action setups around the 1.2751 area which was the June swing highs. Bears will have to wait for 1.3000 before considering shorts as momentum is on the side of the bulls.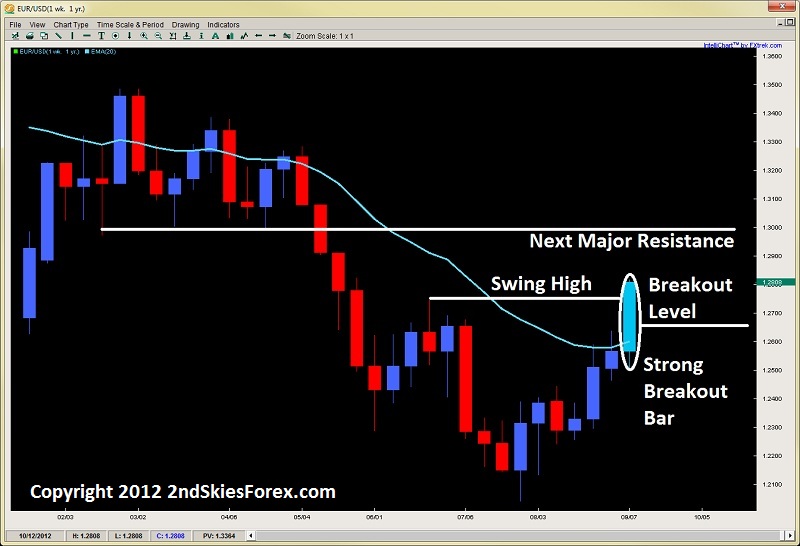 EUR/USD" title="EUR/USD" width="758" height="533">
EUR/AUD
Last Wednesday, I talked about the Bullish Kumo Break for this pair on the daily charts, which was its first daily close since June 5th above the Kumo. Although all the Ichimoku signs were bullish, I suggested looking for longs on a pullback to the kumo flat top just below at 1.2236. Price action then formed a bearish 2 bar reversal setup that went right towards the kumo top.
Price action on the next day literally stopped at 1.2232 and then reversed 104 pips to close the week. Many of our Ichimoku Traders got in on this setup with over 3:1 reward-to-risk so hopefully you profited on this as well.
The tenkan is continuing to rise so should offer support on pullbacks, but the pair will have to clear the 1.2400 before adding new bulls. For now, the 1.2232-1.2400 range should dominate so look for clues off these levels. 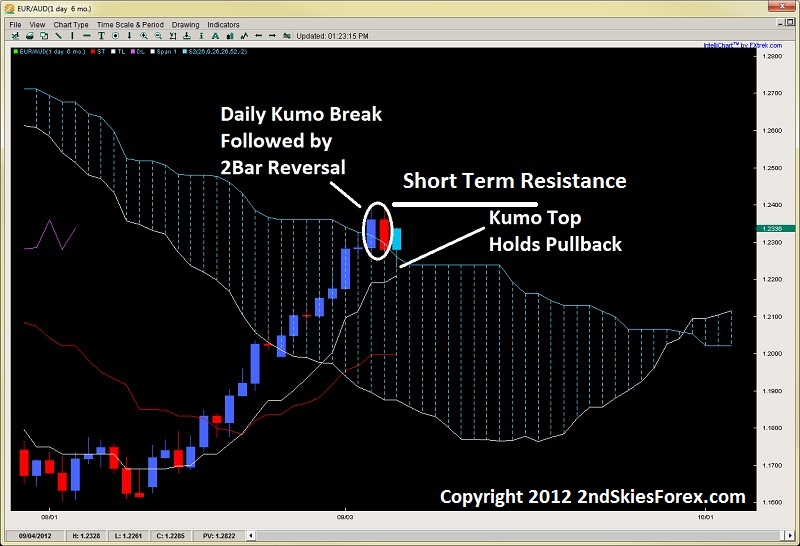 EUR/USD 2" title="EUR/USD 2" width="758" height="533">
Gold
Gaining for the 3rd week in a row (only 2nd time this year), the precious metal took out the $1700 barrier for the first time since March this year, gaining almost $35 on Friday alone. I suspected short covering on the initial structural breakout back at $1633 and the metal has not disappointed since. That plus the likely accumulation building over the summer will continue to underpin the metal.
I’ve been long since $1633 and am still holding this position, along with adding several positions along the way. Bears have near-term resistance at $1752 and $1786-$1800, but beyond that, there isn’t much resistance until $1873.
Bulls can look for price action setups on pullbacks towards $1700, $1676 and $1651 if it can get there. 
Silver
Now in the second leg of its bullish run, after forming a bearish pin bar (likely profit-taking) prior to the NFP report last week, the metal formed a bullish engulfing bar finding intraday support at $32 closing over $1.66 on the day.
Bulls are clearly in control here so any pullbacks into $32.50 or $32 become buying opportunities while next levels of resistance at $34.41 and $34.86 so bears can watch for intraday price action setups there. 
Original post
- English (UK)
- English (India)
- English (Canada)
- English (Australia)
- English (South Africa)
- English (Philippines)
- English (Nigeria)
- Deutsch
- Español (España)
- Español (México)
- Français
- Italiano
- Nederlands
- Português (Portugal)
- Polski
- Português (Brasil)
- Русский
- Türkçe
- العربية
- Ελληνικά
- Svenska
- Suomi
- עברית
- 日本語
- 한국어
- 简体中文
- 繁體中文
- Bahasa Indonesia
- Bahasa Melayu
- ไทย
- Tiếng Việt
- हिंदी
Weekly Price Action And Ichimoku Chart Outlook: September 10, 2012
Published 09/10/2012, 08:09 AM
Updated 05/14/2017, 06:45 AM
Weekly Price Action And Ichimoku Chart Outlook: September 10, 2012
EUR/USD
Latest comments
Loading next article…
Install Our App
Risk Disclosure: Trading in financial instruments and/or cryptocurrencies involves high risks including the risk of losing some, or all, of your investment amount, and may not be suitable for all investors. Prices of cryptocurrencies are extremely volatile and may be affected by external factors such as financial, regulatory or political events. Trading on margin increases the financial risks.
Before deciding to trade in financial instrument or cryptocurrencies you should be fully informed of the risks and costs associated with trading the financial markets, carefully consider your investment objectives, level of experience, and risk appetite, and seek professional advice where needed.
Fusion Media would like to remind you that the data contained in this website is not necessarily real-time nor accurate. The data and prices on the website are not necessarily provided by any market or exchange, but may be provided by market makers, and so prices may not be accurate and may differ from the actual price at any given market, meaning prices are indicative and not appropriate for trading purposes. Fusion Media and any provider of the data contained in this website will not accept liability for any loss or damage as a result of your trading, or your reliance on the information contained within this website.
It is prohibited to use, store, reproduce, display, modify, transmit or distribute the data contained in this website without the explicit prior written permission of Fusion Media and/or the data provider. All intellectual property rights are reserved by the providers and/or the exchange providing the data contained in this website.
Fusion Media may be compensated by the advertisers that appear on the website, based on your interaction with the advertisements or advertisers.
© 2007-2025 - Fusion Media Limited. All Rights Reserved.