
 AUD/USD" title="AUD/USD" height="372" width="700">
Summary:
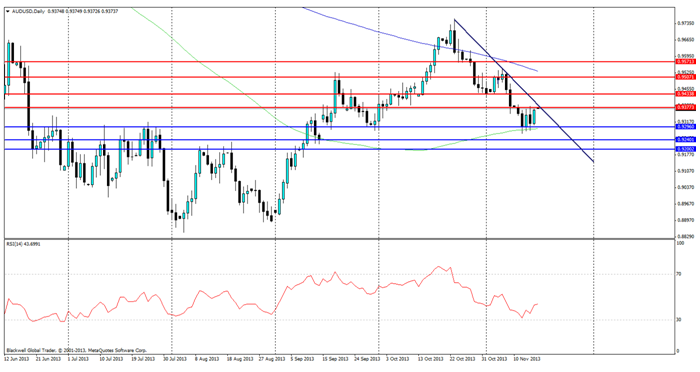
The Aussie dollar managed to remain fairly stable last week, as bad news for the Australian economy, coupled with an aggressive talking RBA were no match for bad news from the USA. As Yellen talked up further quantitative easing as the US economy remained sluggish. Overall this looks likely to be bad news for the bearish AUD traders in the short term, but the long term outlook still suggests further falls are in the works for the AUD.
This week provides very little in terms of economic data apart from the RBA minutes, and a speech by the current governor. It’s unlikely this data would talk up the currency, in any shape or form, and it's more than likely they will take the opportunity to further reiteratetheir current statements that itsover valued.
Current resistance levels can be found at 0.9377, 0.9433, 0.9507 ad 0.9571. It’s unlikely they will be heavily tested due to the bearish market sentiment and current trendlineremaining unbroken. Current support levels can be found at 0.9296, 0.9240 and 0.9200 with major support at 0.9200 which will be the hardest point for the pair if it wants to break further. 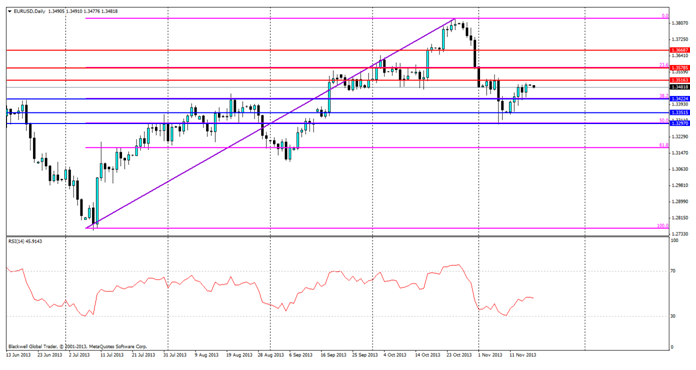 EUR/USD" title="EUR/USD" height="372" width="700">
Summary:
The Euro had a mixed week overall, as industrial production lifted for the year. While CPI data was weaker than expected and showed deflation, nonetheless this was expected as the ECB cut interest rates to accommodate inflation growth. Current market sentiment is neutral with no clear bear or bullish trend in control as of last weeks movements.
Markets will be focusing on this weeks monthly Manufacturing PMI and services PMI which is due out on Thursday, and on Friday consumer confidence for the Euro-zone. Manufacturing and Services are expected to show moderate growth, while consumer confidence is expected to improve again on last month.
Current technical movements show that the EUR/USD is ranging slightly after last weeks mixed bag of data, coupled with a weakening USD after Yellens comments. Resistance levels can be found at 1.3516, 1.3578 (fib 23.6 level) and 1.3668. Support levels can be found at 1.3422 ( fib 38.2 level), 1.3351 and 1.3297 with the major level of support at 1.3351. 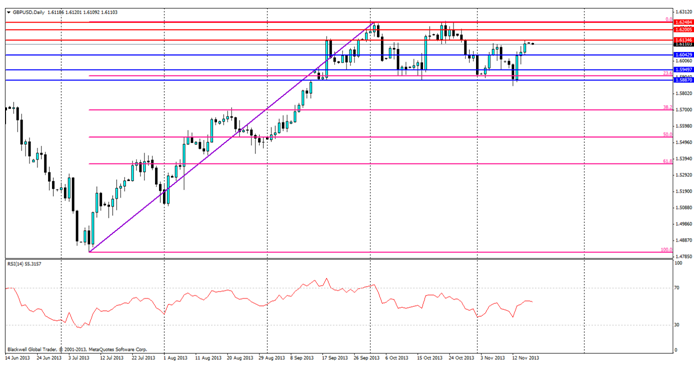 GBP/USD" title="GBP/USD" height="372" width="700">
Summary:
The Pound managed to break out of its bearish trend last week as inflation data showed a decrease overall while average earnings also showed a slowdown over all. Overall though the market was left without a clear direction and it looks likely that it could either climb further or fall further, though any rise would be short lived, as it would touch historic highs if it climbs heavily which would probably lead to a pullback in the current market.
The markets will be quiet for the pound though overall, and will most likely trade heavily on US data which is due out during the week. However, GDP data is due out on Friday and is expected to show strong growth for the quarter as the economy is rebounding heavily after the Euro-zone recession for the past year.
Market technical show that current resistance levels can be found at 1.6134, 1.6200 and 1.6248 with major resistance found at 1.6248 as the level has been tested frequently in the past few weeks. Support levels can be found at 1.6042, 1.5949 and 1.5887.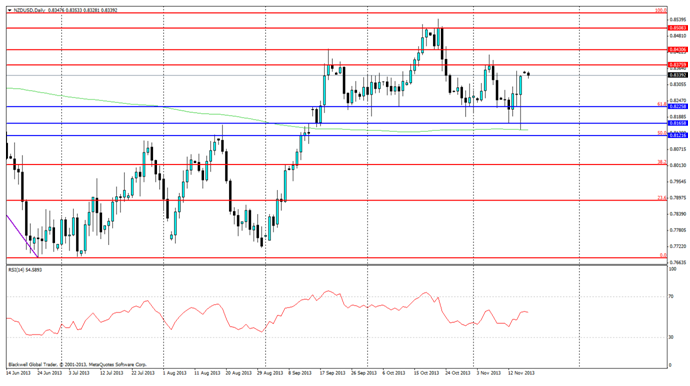 NZD/USD" title="NZD/USD" height="372" width="700">
Summary:
The New Zealand Dollar looks slightly weaker after pushing up heavily before market close on the back of US data which led to a weakening of the US dollar. It was a mixed bag overall though for the high flying kiwi as retail sales were weaker than forecast. However, overall the Kiwi still remains the stand out currency among the commodity currencies, as the Aussie economy starts to try and drag on the NZD.
Traders this week will be watching the PPI input for the country which expected to be stronger for input but slightly weaker for Output. Overall though most major moves will be as a result of the AUD and the USD which is expected to be active this week with their own PPI due out along with Retail Sales.
Market technicals show that resistance can be found at 0.8375, 0.8430 and 0.8508. While market support can be found at 0.8225, 0.8165 and 0.8121. The current RSI shows buying pressure starting to taper off for the currency. It looks likely that some fall could be in the works, however market sentiment is currently still weak as to direction. 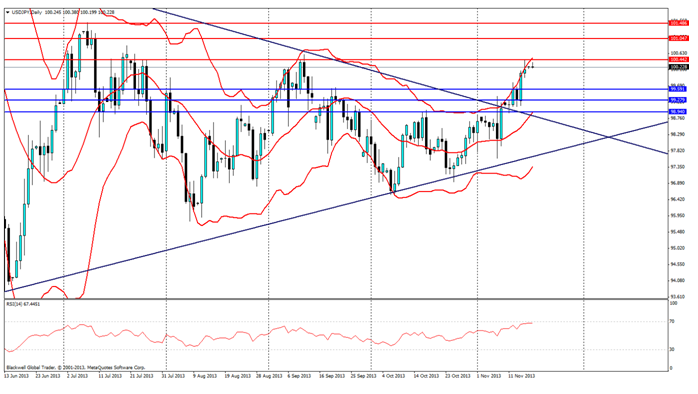 USD/JPY" title="USD/JPY" height="372" width="700">
Summary:
The Yen has broken out of its triangle and shot up to touch the 100 mark. However, markets are still trying to discern the current direction and after touching the 100 mark the pair has looked for further news to help push it further.
The Yen has an opportunity for large movements though as the Trade Balance is due out on Tuesday night, and followed up on Thursday by the Bank of Japan Monetary Policy Statement which is expected to talk up reforms and the need for further stimulus sometime next year to help cushion reforms.
Looking at market technical we can see that current resistance is at 100.442, 101.047 and 101.486 with the major level of support at 100.442. Support levels can be found at 99.591, 99.279 and 98.940. RSI also shows the massive buying pressure for the USD over the Yen, however, this could not signal a pullback due to the slow progression from the RSI chart.
- English (UK)
- English (India)
- English (Canada)
- English (Australia)
- English (South Africa)
- English (Philippines)
- English (Nigeria)
- Deutsch
- Español (España)
- Español (México)
- Français
- Italiano
- Nederlands
- Português (Portugal)
- Polski
- Português (Brasil)
- Русский
- Türkçe
- العربية
- Ελληνικά
- Svenska
- Suomi
- עברית
- 日本語
- 한국어
- 简体中文
- 繁體中文
- Bahasa Indonesia
- Bahasa Melayu
- ไทย
- Tiếng Việt
- हिंदी
Weekly Outlook: Yen Breaks Out, Aussie Remains Stable
Published 11/18/2013, 05:38 AM
Updated 05/14/2017, 06:45 AM
Weekly Outlook: Yen Breaks Out, Aussie Remains Stable
Latest comments
Loading next article…
Install Our App
Risk Disclosure: Trading in financial instruments and/or cryptocurrencies involves high risks including the risk of losing some, or all, of your investment amount, and may not be suitable for all investors. Prices of cryptocurrencies are extremely volatile and may be affected by external factors such as financial, regulatory or political events. Trading on margin increases the financial risks.
Before deciding to trade in financial instrument or cryptocurrencies you should be fully informed of the risks and costs associated with trading the financial markets, carefully consider your investment objectives, level of experience, and risk appetite, and seek professional advice where needed.
Fusion Media would like to remind you that the data contained in this website is not necessarily real-time nor accurate. The data and prices on the website are not necessarily provided by any market or exchange, but may be provided by market makers, and so prices may not be accurate and may differ from the actual price at any given market, meaning prices are indicative and not appropriate for trading purposes. Fusion Media and any provider of the data contained in this website will not accept liability for any loss or damage as a result of your trading, or your reliance on the information contained within this website.
It is prohibited to use, store, reproduce, display, modify, transmit or distribute the data contained in this website without the explicit prior written permission of Fusion Media and/or the data provider. All intellectual property rights are reserved by the providers and/or the exchange providing the data contained in this website.
Fusion Media may be compensated by the advertisers that appear on the website, based on your interaction with the advertisements or advertisers.
© 2007-2025 - Fusion Media Limited. All Rights Reserved.