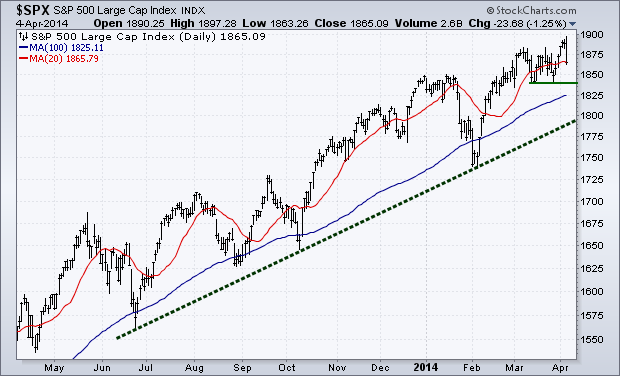
Reviewing last week's price movement, we had some increased selling on Friday as the S&P 500 (SPX) broke back through the previous March high. Equity bulls would have preferred to see that level hold as support. While it ‘felt’ like a panic selling as we cut through would-be support, we only saw roughly 70% of volume come from selling and 60% of issues trade down. Typically we see these numbers hit 80% or 90% during panic selling.
Equity Trend
The up trend is still intact for the S&P (SPX). If the sell-off that began on Friday continues I’ll be watching the previous low set in march to hold as potential support since the March high has already failed. We closed out trading last week with price just a few cents under the 20-day Moving Average, which I believe is positive for bulls as some would argue that the MA was not ‘fully’ violated just yet.
Equity Breadth
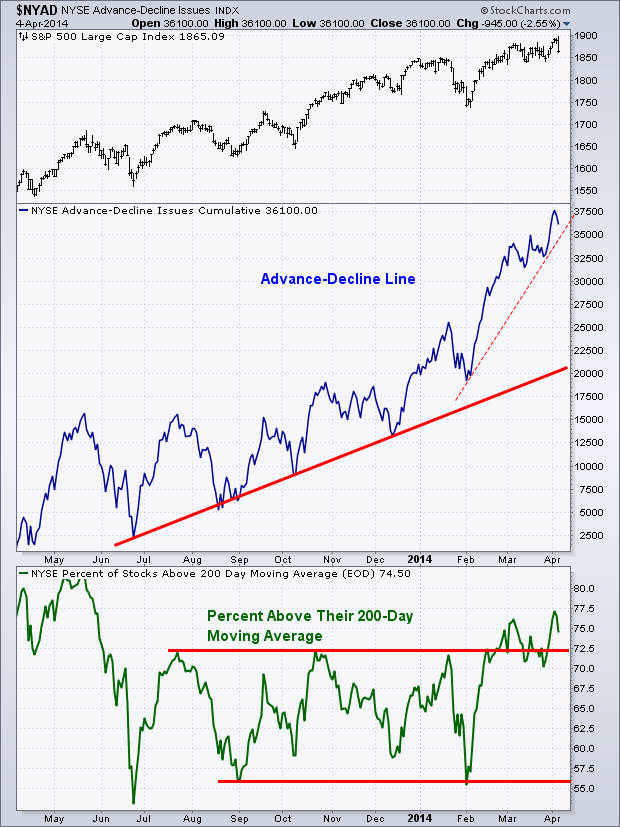
A few weeks ago I showed a chart of the number of New Highs minus New Lows totaled for the week. I mentioned that while the Advance-Decline Line was still showing strength, this measure of breadth that looks at the number of New Highs was making lower lows. With the new all-time high last week in the S&P 500, we yet again saw another new low in this measure of breadth (not shown).
As the chart below shows, the Advance-Decline Line held up well during heavy selling on Friday. This measure of market breadth is still above its short-term trend line and well above its long-term trend. The Percentage of Stocks Above Their 200-day Moving Average confirmed the higher-high last week and stayed above its level of support on Friday. From a breadth standpoint, things still appear positive with the Advance-Decline Line still above its March high.
Equity Momentum
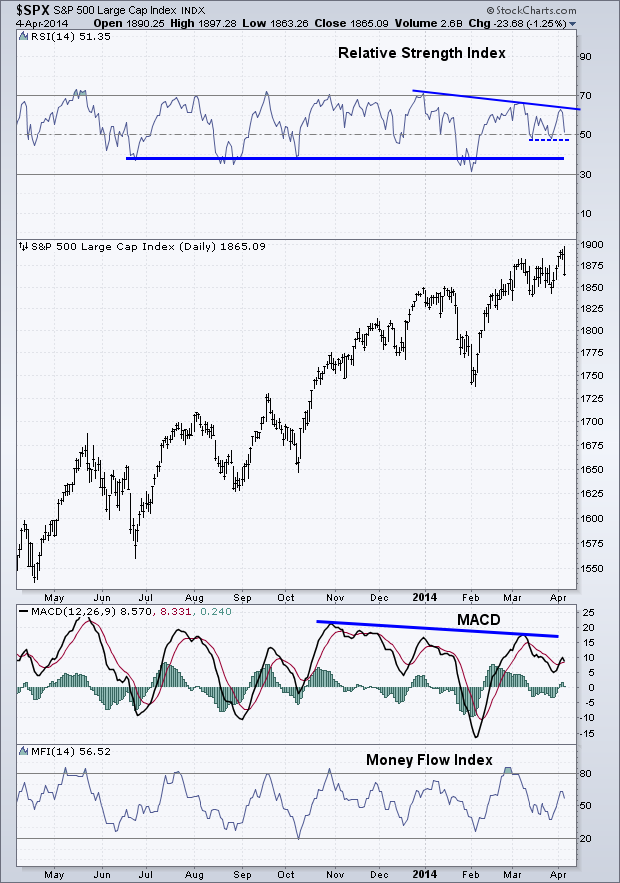
Once again, we saw another lower high in the developing divergence in the Relative Strength Index (RSI) and price. Momentum is currently the biggest concern for the equity market at the moment, in my opinion. While we still have fairly strong breadth as mentioned above, momentum is continuing to weaken. On any further selling I’m still watching the 49 level as support for the RSI indicator. The MACD momentum indicator is also still showing a negative divergence, although it was able to make it above its March high which is slightly positive for stocks.
Bonds
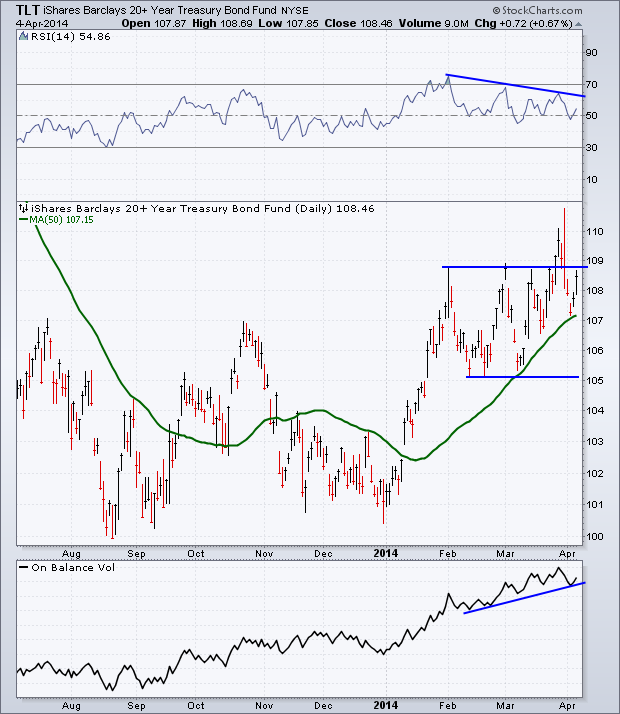
It’s been a few weeks since I’ve discussed the bond chart, specifically the iShares 20+ Year Treasury ETF (ARCA:TLT). Price continues to trade in a range between $109 and $105. We did see a false breakout two weeks ago, but price quickly fell back into its range. Looking at momentum and volume we are getting two different messages. With the Relative Strength Index (RSI), a negative divergence has continued to develop as it makes lower highs. However, the On Balance Volume, which adds up the number of shares traded on up days and subtracts volume on down days to measure buying and selling pressure, appears to be showing a bias towards buyers as it makes higher highs. The 50-day Moving Average continues to act as support during short-term sell-offs and since its current rising, is a positive area of support for those bullish on bonds.
60-Minute S&P 500
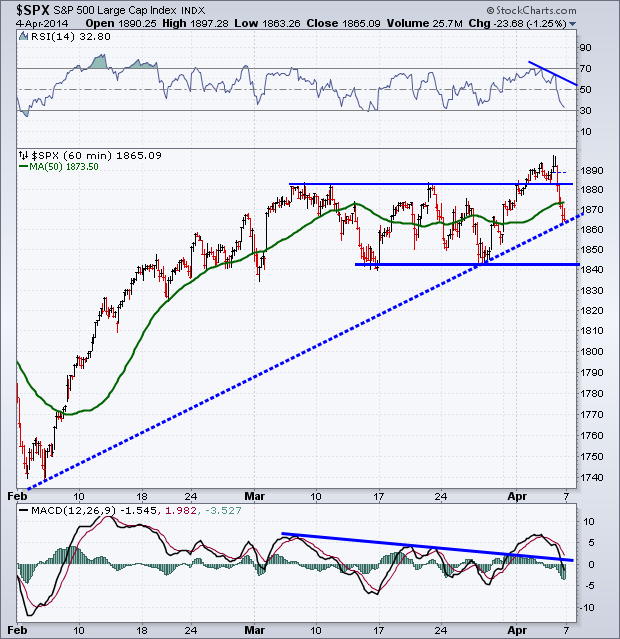
The 60-minute chart for the S&P 500 (SPX) has been giving us a lot of clues during the choppiness of trading these past few weeks. I’ve been watching the channel on this short-term chart with resistance at the March highs around 1880 and support at the March lows near 1840.We broke above resistance momentarily and were unable to turn resistance into support on last Friday.
As the equity market challenged and broke through the previous high we saw a small negative divergence of lower highs created on the Relative Strength Index. This signaled that buyers may not have been as strong as many would have hoped. While the MACD was able to break its negative trend, Friday’s selling pushed it back under as sellers took over. One Positive to note is the trend line off the February and March lows. Selling on Friday was halted when this trend line, as shown on the chart below, was hit. I’ll be watching this week if this trend line can hold up and buyers take back control of the S&P and see if we can get another opportunity for a new high. If the trend line breaks then we’ll likely see a test of the March low which will likely act as a line in the sand before the start of a short-term down trend.
Last Week’s Sector Performance
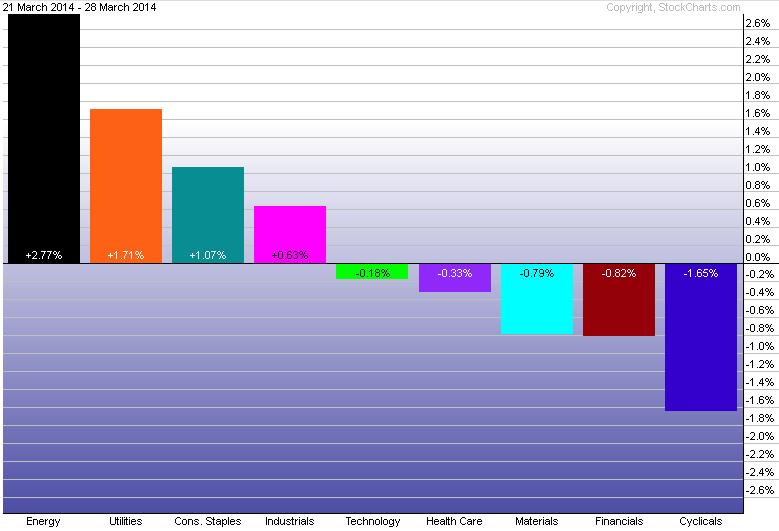
The energy sector (SPDR Energy Select Sector Fund (ARCA:XLE)) was the strongest relative performer last week. I discussed the chart for energy in March 24th’s Weekly Technical Outlook. Utilities (SPDR Select Sector - Utilities (XLU)), consumer staples (SPDR - Consumer Staples (ARCA:XLP)), and industrials (Industrial Sector SPDR Trust (ARCA:XLI)) were also positive last week. Consumer cyclicals (SPDR Consumer Discretionary Select Sector (ARCA:XLY)) and the financial sector (Financial Select Sector SPDR Fund (ARCA:XLF)) were the worst performers.
Year-to-Date Sector Performance
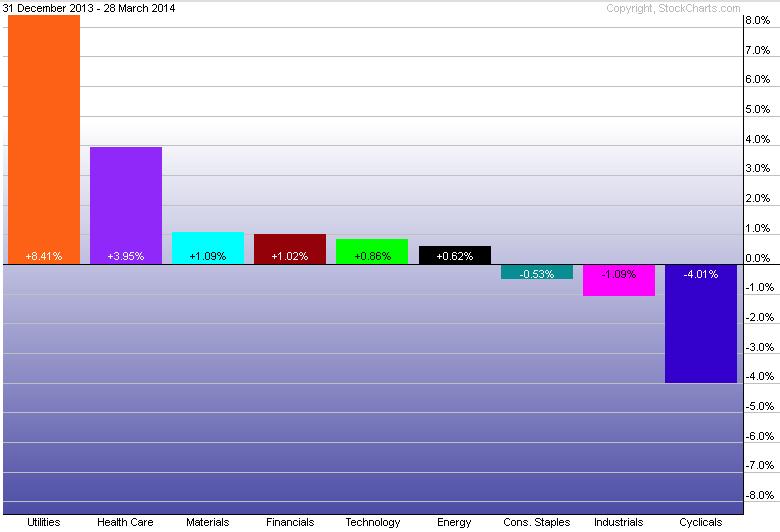
Not much as changed YTD as it pertains to sector performance. Utilities (SPDR Select Sector - Utilities (XLU)) and healthcare (SPDR - Healthcare (ARCA:XLV)) continue to lead for 2014. With consumer cyclicals (SPDR Consumer Discretionary Select Sector (ARCA:XLY)) the worst performing sector for the year.
Major Events This Week
This is a pretty light week for economic data with the FOMC minutes likely to garner the most attention. Commentators will likely be interested in reading further detail about the Fed dismissing unemployment as a critical trigger for interest rate policy.
Disclaimer: Do not construe anything written in this post or this blog in its entirety as a recommendation, research, or an offer to buy or sell any securities. Everything in this post is meant for educational and entertainment purposes only. I or my affiliates may hold positions in securities mentioned in the blog. Please see my Disclosure page for full disclaimer.

