Last Monday saw Bitcoin stage a flash surge, moving from the lows of the previous day at $6,171, to as high as $7,035, before retracing to just under $6,600. This is the highest that Bitcoin has been able to achieve in close to 2 months. This price spike really had nothing to do with any fundamentals in Bitcoin, but rather was more about the dissociation from parity by Tether (USDT) from the US Dollar. We saw Tether drop all the way to 85 cents to the US Dollar on some platforms, and this caused a corresponding price gain in many cryptos which were traded against the US Dollar. As traders began to see Bitcoin prices head higher, a demand surge followed, sending the price of Bitcoin all the way up to $7,800. What followed thereafter further confirmed that this move really had nothing to do with Bitcoin, as prices have since retraced to the resistance levels of the last two weeks.
Price action has since then, not really gone anywhere. To understand what the outlook for BTC is for the week, two charts are featured in this piece. The weekly chart defines the trend on the long term chart, while the daily chart provides the medium term focus for a financial asset.
An understanding of the long term price activity on the weekly chart of Bitcoin will help traders understand what is going on, and also help them plan their trades for the week. So here is the trading outlook for Bitcoin for this week, starting October 22, 2018.
Image Credit: Bitfinex BTC/USD Weekly Chart: Tradingview.com
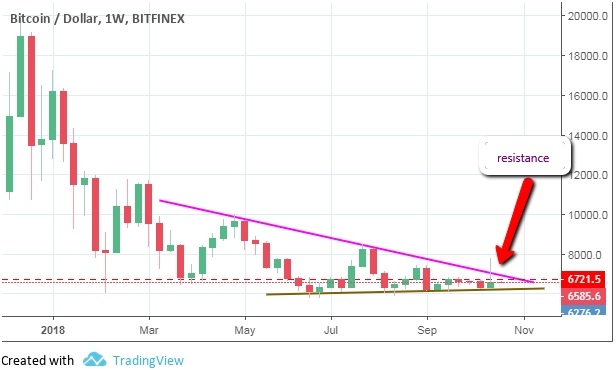
A look at the weekly chart for the BTC/USD pair, which showcases price action over several months and even years, will indicate that the price action of Bitcoin for 2018 has basically formed a descending triangle setup with defined upper and lower borders. While the support level has moved between $5,800 and $6,000, the resistance level has been defined by progressively lower highs, kick-starting the year at highs of $12,000 and now found at just above the $7,000 mark. The dwindling resistance levels shows just how much under pressure Bitcoin prices have been the whole year. Therefore, the price moves that have occurred from January 2018 till date, have basically respected the long term support and resistance areas that have been formed on the chart from price movements earlier in the year.
This is why it is critical to always look at the weekly chart to get some trading focus for Bitcoin. If a short term chart such as the hourly chart were to be used to view last Monday’s price surge in Bitcoin and other Bitcoin-derived cryptos such as Bitcoin Cash and Litecoin, it would look like Bitcoin had started to find great upside momentum to take it to the highs predicted last year. But in reality, there was nothing new about the price movement. We can see from last week’s weekly candle that the upper shadow simply represents the spike and retracement from what has remained the upper limit of price action for several months. So technically speaking, nothing has changed as far as the support and resistance levels on the weekly chart are concerned.
Image Credit: BTC/USD Daily Chart
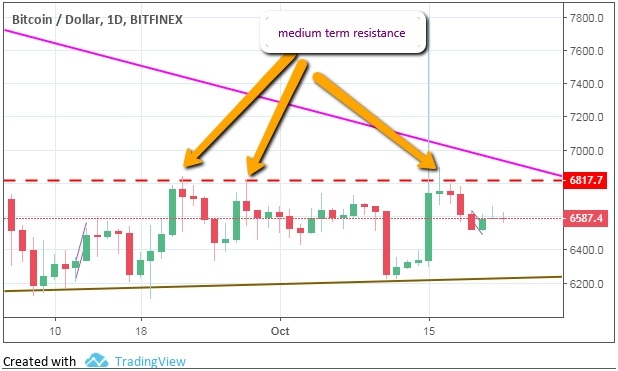
So the outlook for the week is as follows. Price action hit a high of $7,800 on the Bitfinex exchange (figures vary from exchange to exchange) on Monday October 22 before retreating to the daily resistance levels seen in the last one week at around $6,800.This shows that the bulls are yet to gather the momentum that is required to sustain the upward push. For a sustained rally to occur, Bitcoin must sequentially break the current resistance levels of $6,800, $7,200, $8,000 and the $10,000 mark.
To the downside, we see a price level of $6,200 as the medium-term support level which the number 1 crypto has to break before it can attain the long term support located at the $5,800 level.
With clearly defined levels of support and resistance, we may continue to see BTC trading within the ranges identified by the horizontal support and resistance lines. Giving credence to this theory is the fact that sellers were able to force prices back down from last Monday’s highs, and the bulls have so far been unable to force prices any higher than the dotted red resistance line. Price movement may pick up this week after last week’s dull end to the week. Subsequent price action for the week will continue to trade in the defined range.
It must be pointed out that price movements on the weekly chart may take several weeks to play out, so traders must watch the time charts that they use to gain a perspective on how quickly market events will evolve.


