Near-term gold prices have been hostage to trade developments.
The zig-zags in the U.S.-Sino talks are dominating gold, as well as a plethora of other asset classes where investors tend to wear trade war emotions on the sleeve. Still, the lack of clarity as to when the first phase of the trade pact will be signed could offer some tangible support. After all, the long-running trade war has met many snags and dead ends along the way. However, it's hard to step in front of a runaway train, but at least some uncertainty could temper the keenness in risk markets on good news, and thus slow gold price decline. That said, should the next round of trade comments bear juicy fruit, gold could just as quickly plummet again.

Last week was a “highway to hell “for gold bulls and the most significant weekly loss in more than two years. It's not so much that gold doesn't remain an attractive vehicle in a lower for longer, more prolonged interest rate environment. Still, there’s just a lot of length in the market, and the fear those investors might get spooked out of positions is a significant concern for market makers.
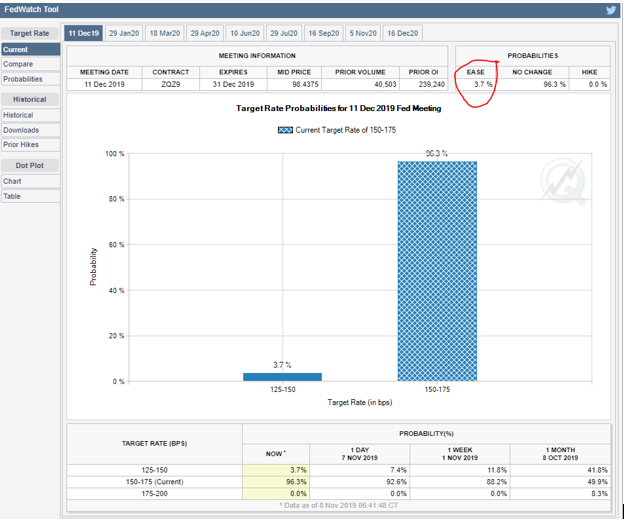
Before institutional traders might be enticed back into the buying mood, there may need to be a significant position clear-out. In the meantime, CTA strategies are expected to remain short-sellers, as gold could move lower facing a strong U.S. dollar and higher U.S. yields, alone even without a nudge from a trade truce. Fed futures now show a near-zero per cent chance of another rate cut this year, according to the CME. So, while global monetary policy is gold supportive, absent a Fed policy impulse, that argument is somewhat watered down.

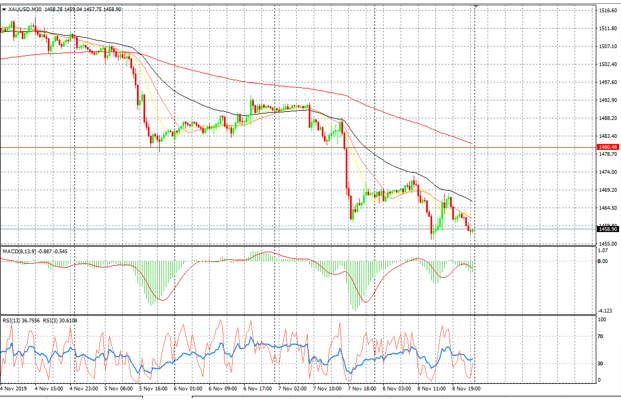
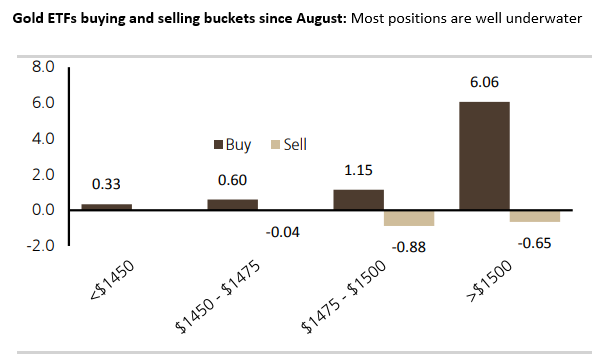
Although USD 1460 /oz is a crucial technical inflexion point, the temptress might be what lies below, and that is the psychologically key U.S.D 1450/oz level. ETFs and the 6 million ounces bought since August are mostly in at much higher levels, suggesting that there is room for a greater unwind if trade talks between the U.S. and China continue to move toward a material deal and global rates continue to bounce higher. The thinking is that in this scenario if gold prices break the U.S.D 1450/oz level, the market may drop to nearer U.S.D1,425/oz in a heartbeat if ETF gold investors start to bale out of deep underwater positions.
Gold ETFs buying and selling buckets since August: Most positions are well underwater

While gold could consolidate in the near-term, note that risks remain incredibly high for a further decline based on a plethora of bearish catalysts.
The bulk of the recent gold market decline is being driven by what’s going on in the U.S. bond markets. And while numerous gold correlations come and go but there is one stable and enduring signal for gold investors, and that’s the path of U.S. 10-year treasury yields. When U.S.T 10 y yields rise gold falls and vice versa. But with nominal yields close to 2% 10-Y TIP’s (Treasury Inflation-Protected Securities) at the highs of the three-month range, and 10-Y rates in Germany and Japan have risen back to levels last seen in early summer gold looks much less attractive.
Why the fixation with 10-year U.S. yields? Besides the David to Goliath analogy where bond market dwarfs the gold market for investment appeal. It’s also because it takes approximately that much time to develop a gold mine. The time it takes for exploration, development, taking environmental clearance and operation spans from 5-years to 8-years approximately. So that is why the 10-year yield is more reliable than short term interest rates like 2-year notes.
For much of 2019, the market has weaved a convincingly bullish narrative based on central bank demand. In November 2018, PBoC gold purchases were the clearest signal that China was digging in for the long haul on the trade war front and provided a significant impulse for investors to buy gold. Last week China reported a halt in gold purchases for the first time in ten months. Recall the PBoC gold purchases in late 2018 was the primary catalyst that started the 2019 version of the gold rush. With the PBoC possibly reducing gold purchases and removing that critical central bank backstop, gold investors may not have the same sense of bravado as what they had when the PBoC was backing up the truck on gold markets. So, will the reverse hold true that if China is hitting the pause button could that be interpreted that we have finally reached a thaw in the U.S.-Sino tensions?
Bearish Catalysts
