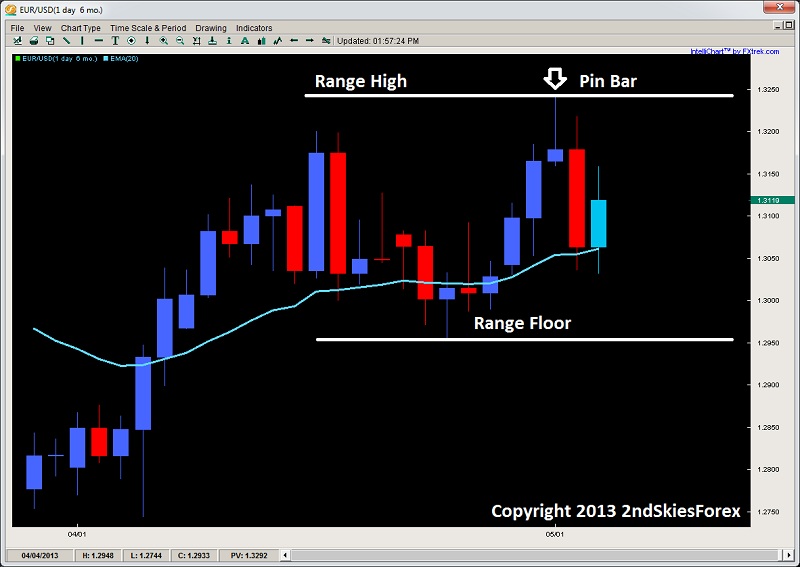
The chopfest continues for the euro, which sold off almost 200 pips from the pin bar signal we discussed last week. The pair is now inside a larger range, with a ceiling of 1.3240 and a floor of 1.2950. With the recent sell-off finding buyers ahead of support on the 20ema, we may see another push higher first. But as the nature of the range has been quite choppy, I’m not willing to trade it till the range top or bottom. EUR/USD" title="EUR/USD" width="800" height="458">
EUR/JPY
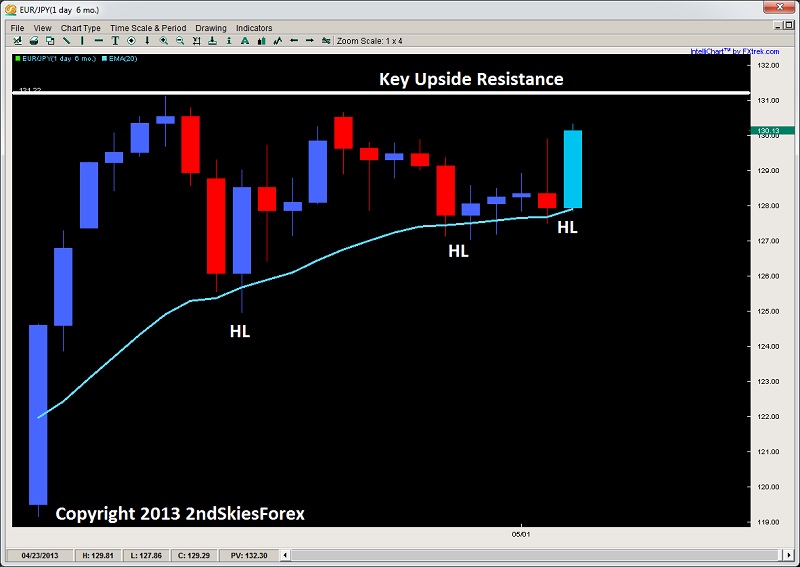
Despite having a few setbacks, this pair continues to build up buyers consistently around the dynamic support and daily 20ema which has held the pair up since the middle of April. The strong buying on Friday erased several days of losses, so the pair should likely challenge the yearly high at 131.22. Bears can look for intra-day price action signals here, while bulls can look for pullbacks into the 20ema and 128.50 region to get long. This type of price action building with the consistent HL’s (higher lows) while having a consistent high, suggests upside continuation. EUR/JPY" title="EUR/JPY" width="800" height="458">
GBP/JPY
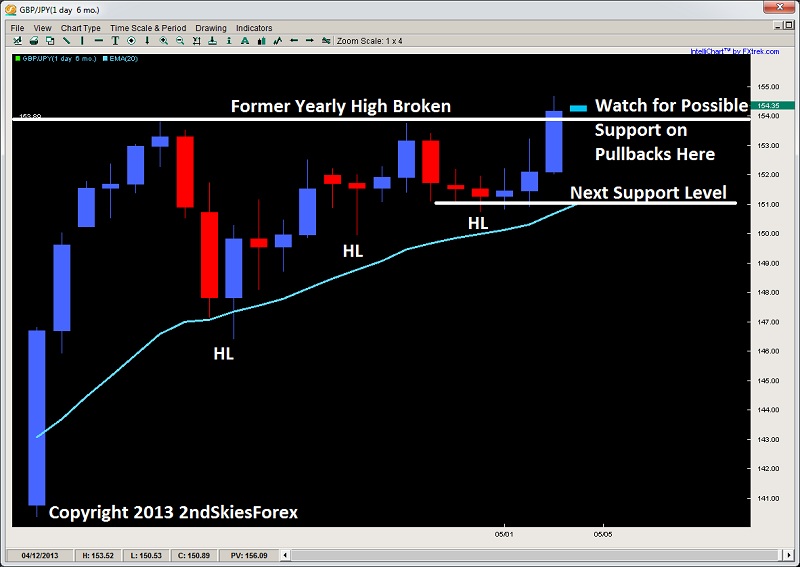
Similar to the EUR/JPY, the GBP/JPY has shown even greater support amongst buyers by taking out the yearly high at 153.89 to end last week. This pair has levitated above the 20ema, communicating how the buyers were continually stepping in on dips and expecting higher prices. Upside targets are now 155.84 and then not much is around till 160 and 162.60, so a lot of air up there, thus we remain buyers on dips into 153.80 down to 151.30. GBP/JPY" title="GBP/JPY" width="800" height="458">
Gold
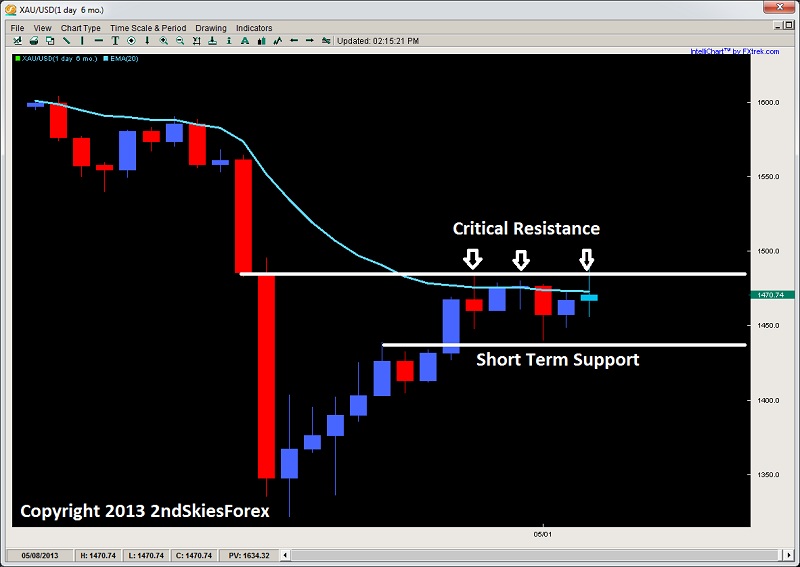
On Tuesday in my fx market commentary, I talked about the significance of the $1480/84 level and that bears can look for shorts there. The PM sold off over $40 from the level so hopefully you profited from this. The precious metals ability to hold at this level is impressive to say the least. The range highlighted in the chart below still takes precedence, so play this like a range till it breaks either side of the fence. A break above $1484 targets $1500 and $1520, while below $1440 brings up $1432 and $1425. XAU/USD" title="XAU/USD" width="800" height="458">
Original post
- English (UK)
- English (India)
- English (Canada)
- English (Australia)
- English (South Africa)
- English (Philippines)
- English (Nigeria)
- Deutsch
- Español (España)
- Español (México)
- Français
- Italiano
- Nederlands
- Português (Portugal)
- Polski
- Português (Brasil)
- Русский
- Türkçe
- العربية
- Ελληνικά
- Svenska
- Suomi
- עברית
- 日本語
- 한국어
- 简体中文
- 繁體中文
- Bahasa Indonesia
- Bahasa Melayu
- ไทย
- Tiếng Việt
- हिंदी
Weekly FX Price Action Chart Outlook: May 5 -10, 2013
Published 05/05/2013, 02:24 AM
Updated 05/14/2017, 06:45 AM
Weekly FX Price Action Chart Outlook: May 5 -10, 2013
EUR/USD
Latest comments
Loading next article…
Install Our App
Risk Disclosure: Trading in financial instruments and/or cryptocurrencies involves high risks including the risk of losing some, or all, of your investment amount, and may not be suitable for all investors. Prices of cryptocurrencies are extremely volatile and may be affected by external factors such as financial, regulatory or political events. Trading on margin increases the financial risks.
Before deciding to trade in financial instrument or cryptocurrencies you should be fully informed of the risks and costs associated with trading the financial markets, carefully consider your investment objectives, level of experience, and risk appetite, and seek professional advice where needed.
Fusion Media would like to remind you that the data contained in this website is not necessarily real-time nor accurate. The data and prices on the website are not necessarily provided by any market or exchange, but may be provided by market makers, and so prices may not be accurate and may differ from the actual price at any given market, meaning prices are indicative and not appropriate for trading purposes. Fusion Media and any provider of the data contained in this website will not accept liability for any loss or damage as a result of your trading, or your reliance on the information contained within this website.
It is prohibited to use, store, reproduce, display, modify, transmit or distribute the data contained in this website without the explicit prior written permission of Fusion Media and/or the data provider. All intellectual property rights are reserved by the providers and/or the exchange providing the data contained in this website.
Fusion Media may be compensated by the advertisers that appear on the website, based on your interaction with the advertisements or advertisers.
© 2007-2025 - Fusion Media Limited. All Rights Reserved.
