All my market opinions reflect my own trading behavior, this behavior is based on Elliott waves law. My opinion cannot be considered as an investment advice and may or may not match with market opinions of other trading2day.com authors.
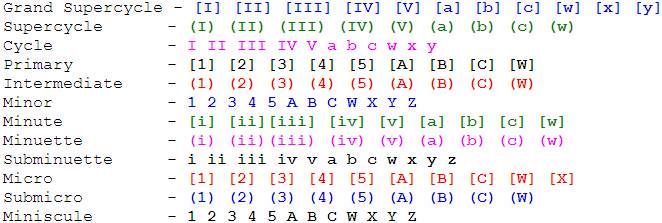
Waves labels table. Degree of our waves on charts may or may not match with yours, it is not an error.
Virgin space on our charts is the place in impulse, with no overlaps. This space could serve as a support-resistance level or a target for a next high degree wave. Usually arises in the third wave of the third wave – the middle of the middle.
Friday morning, 28 July 2017, short-term view.
We make our week end look at FOREX market. The main event we wait for is US dollar reverse and rise against all major currencies. US dollar opponents have not shown any reverse sign yet, except for frank, but Swedish krona has just made another drop. We see a topping process, dollar should reverse soon and change its direction. Despite a lack of reverse movement we do mark possible tops on all charts. Once again we note, that making deals in the old market direction has clearly become dangerous. We keep a long term SELL position on GBP/USD.
EUR/USD spot.
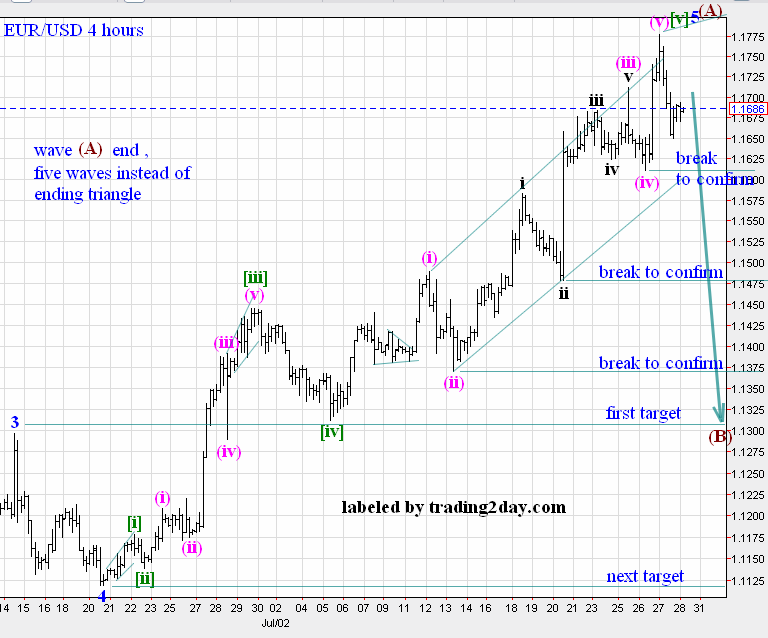
Slightly remarked last wave on euro. We tend to count five waves instead of an ending triangle, as we have done previously. Price should break our confirmation levels to say, that rise is over. We wait for a clear first fall in wave (B).
GBP/USD spot.
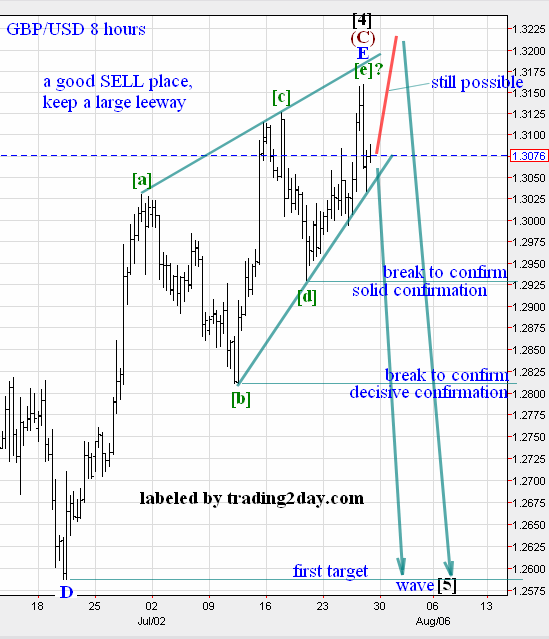
The most reliable and profitable deal among all other markets – to SELL pound against US dollar in wave [5]. SELL opportunity is still valid.
The last wave C on pound is an ending triangle that add more confidence to our assumptions.
The end of this ending triangle has not confirmed yet, and we still consider the last upward thrust marked with red. All new SELL positions should have a large money leeway to endure this possible thrust, upward move toward 1.3230 should not deplete more, than of 30%-40% of initial value at trading account. Again we have marked confirmation levels for wave [5] start.
USD/CHF spot.
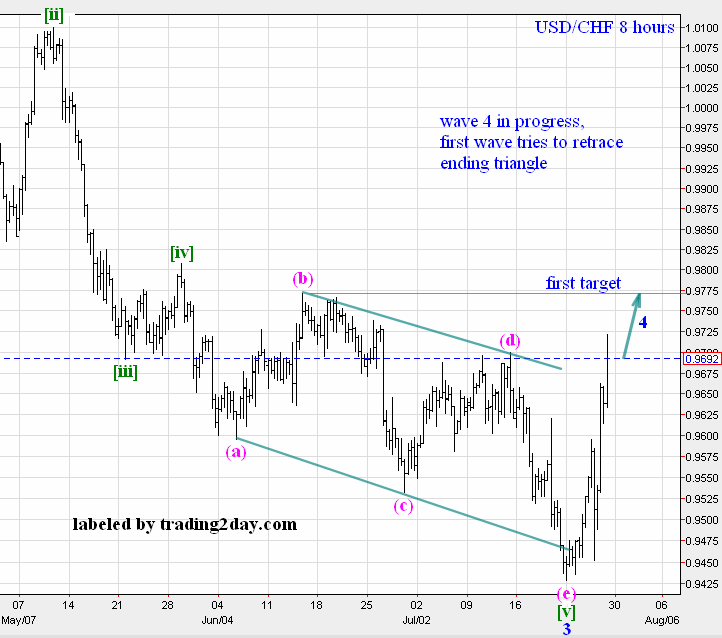
Frank is already rising. First wave up tries to retrace the whole ending triangle length.
A good push for other currencies.
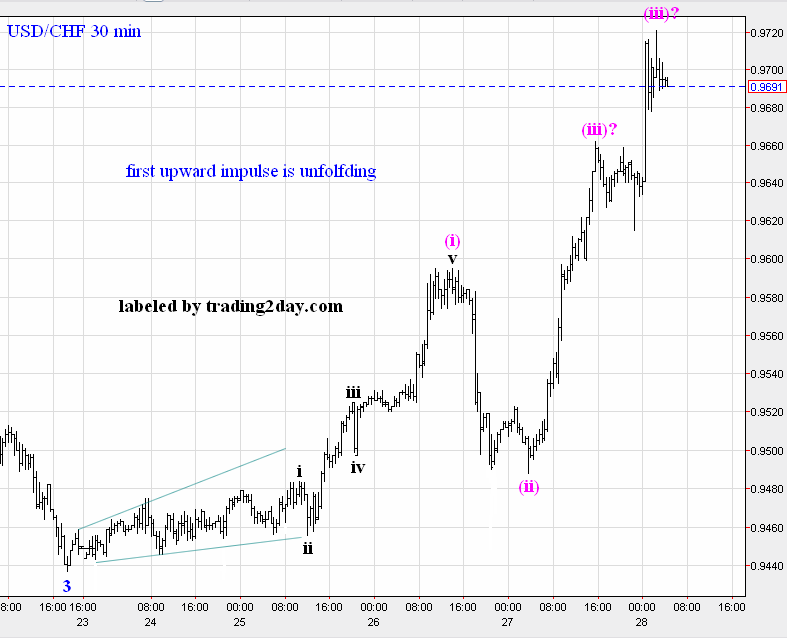
Our probable count for a first move. Impulsive form looks good enough.
USD/CAD spot.
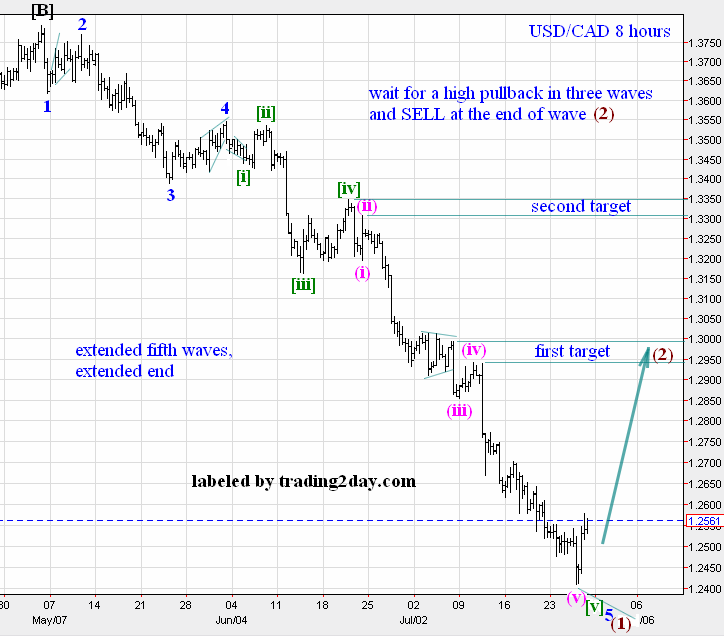
Extended Canadian dollar move. We tend to treat this move as a single wave with extended fifth waves. Some kind of arise is already visible, we hope this rise will go on. Extended fifth waves assumes a high correction in wave (2). The best tactics is to wait for wave (2) to unfold itself as a three waves, wait for wave (2) to enter our target space and SELL once again. But some BUY could also be possible.
USD/SEK spot.
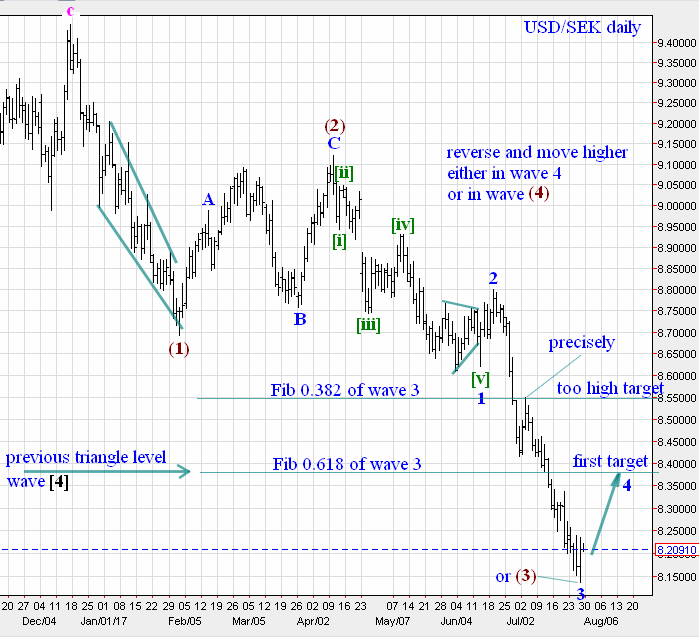
Swedish krona. We do think, that wave (3) is ending now, but its waves form suggests two possible variants:
1) Wave (3) is ending now
2) Just a part of wave (3) is ending now.
Both variants say the same – move down is ending. We shall track krona closely to define the end of wave (3) and pullback level of awaited wave (4). Currently USD/SEK offers a good swap rate for BUY positions, giving up to +13 points per every day.
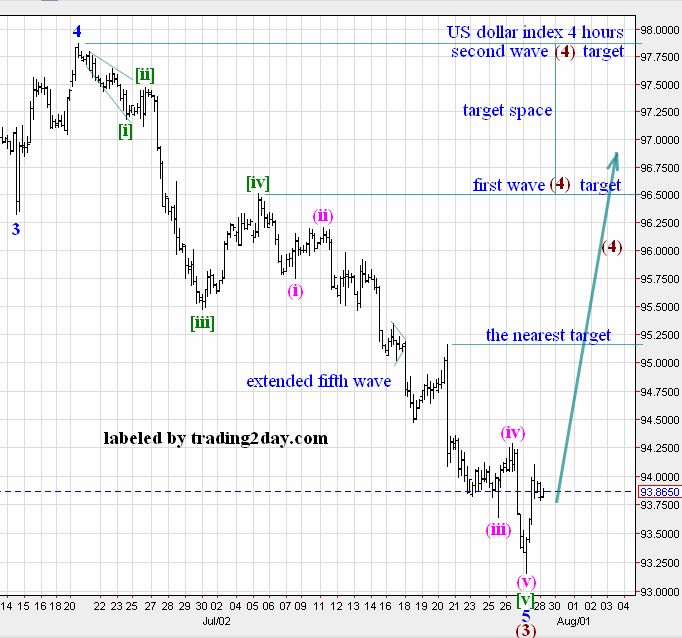
As we can see, move down should reverse now or has already reversed. We wait for decisive signs of wave (4) move. We note, that index has fifth wave extension too, as EUR/USD has. But index wave’s form is more close to five wave impulse, than euro’s wave’s form, where we have previously supposed ending triangle.
USD/Yuan spot.
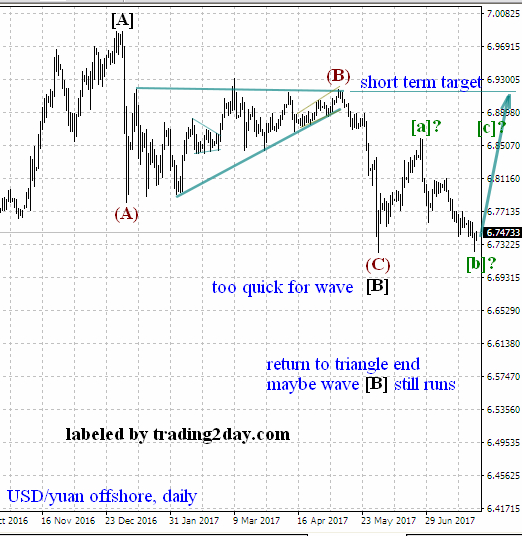
Three waves (A)-(B)-(C) down should eventually be changed with a move to the nearest target – wave (B) end, making a move “Back to triangle”. But this move is still lazy to start. Lack of impulsive form in any rise may tell us, that wave [B] is not over yet, and we are still in correction. Anyway, move up should start soon or now and try to reach our target. We have shown some BUY setup in our previous articles, this setup is still valid and could be valid even at one more short drop, but it is too expensive to keep a long term BUY on USD/Yuan with a current swap rate. To SELL British pound against US dollar is more attractive now. Chinese yuan is a vivid currency for export-import operations and we could offer more detailed and frequent analysis to forecast importer-exporter value gains and value gains of any fixed-term contract.
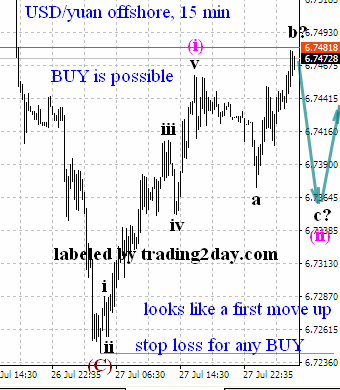
Possible first wave up in offshore yuan. At least this move is more impulsive, than old rise attempts. Some not very attractive BUY opportunity (too high swap rate).
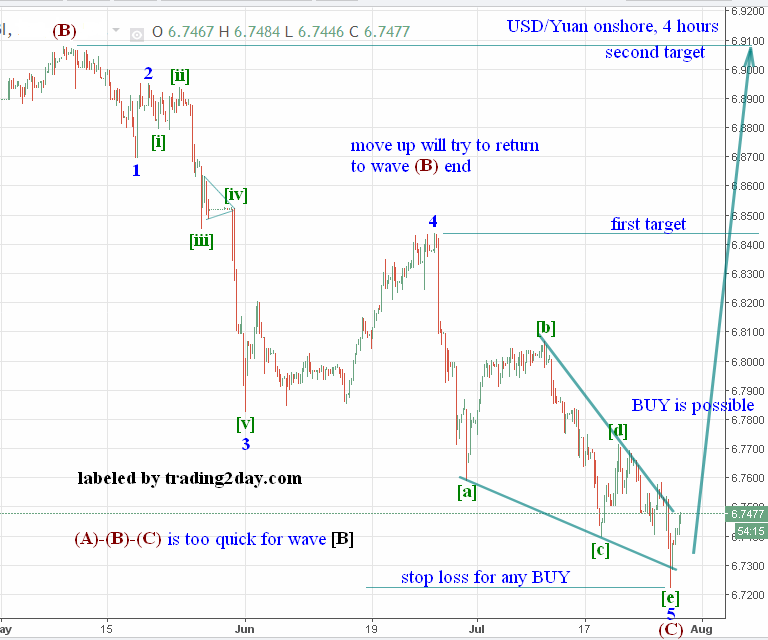
Onshore yuan shows clear ending signs – a complete five wave impulse and an ending triangle in wave 5. The same could be said for onshore yuan – wave [B] may still run, next move may still be a part of correction. But we await rise here, and this rise will be significant, target is the same – the end of triangular wave (B).
Bitcoin/USD spot.
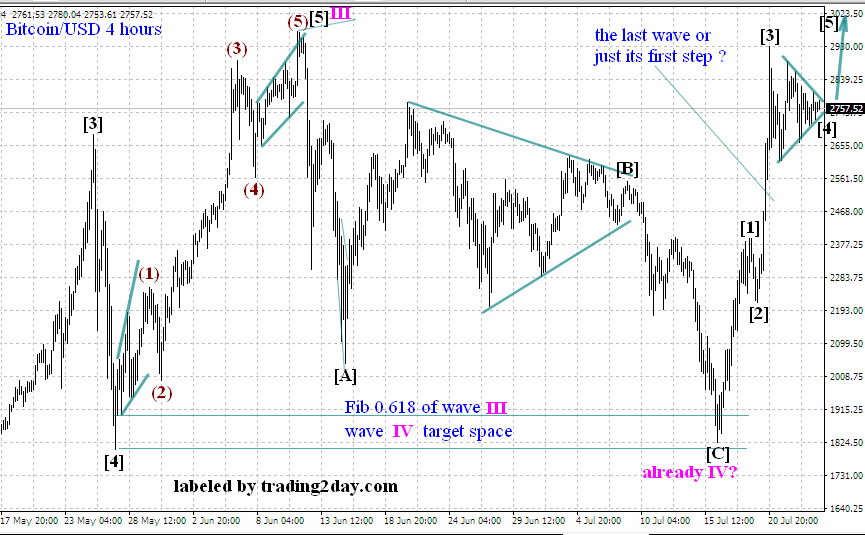
Our previous layout for wave IV. Wave IV may still unfolds as a flat surface or even triangle. All, that we have said for a long term bitcoin move, can be repeated here – SELL your bitcoin property above wave III top and do not hope for a rise anymore. No BUYs now by our opinion. As you can see, some correction is needed for our waves count.
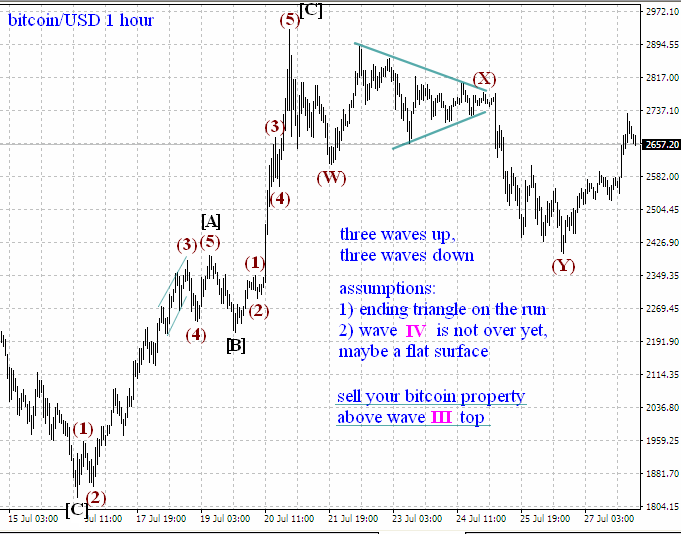
Strong wave up has unfolded into three waves. What will be next? We suppose, that either wave IV is not over yet or we see its wave [B], or the last move up is an ending triangle and we have just seen its first wave (A). No BUYs now, wait and count. Prepare to SELL your cash bitcoin property – hardware, coins, mining pools shares – is the best tactics.
Week ends with waiting for US dollar reverse.
Disclosure: None of the information or opinions expressed in this blog constitutes a solicitation for the purchase or sale of any security or other instrument. Nothing in this article constitutes investment advice and any recommendations that June be contained herein have not been based upon a consideration of the investment objectives, financial situation or particular needs of any specific recipient. Any purchase or sale activity in any securities or other instrument should be based upon your own analysis and conclusions.
by Artyom Chefranov
