Investing.com’s stocks of the week
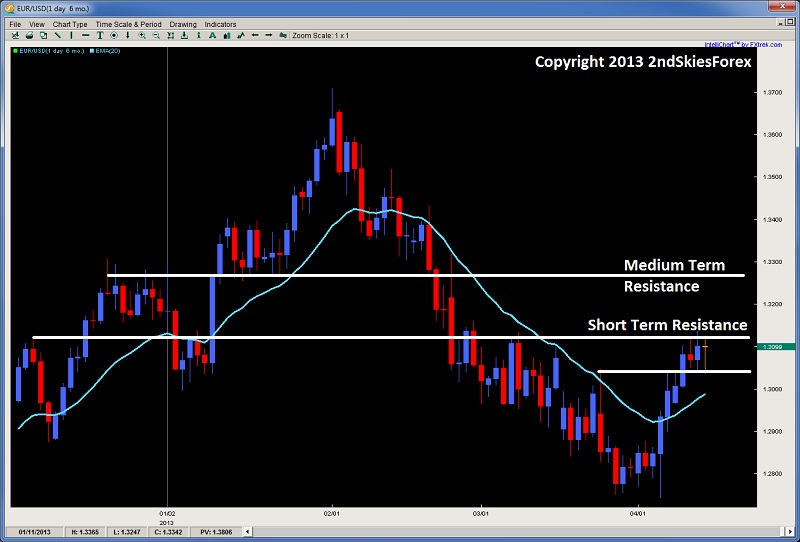
EUR/USD
Gaining three of the last 5 days, the short term bull run has ran into the key resistance level discussed in last week's market commentary at 1.3107, attempting to break it three times. Failing to do so, it has settled into a relative range between 1.3115 and 1.3037. A break above targets the 1.3254 area, while breaking down below 1.3037 will cause some profits to be taken and a likely further retracement towards 1.2948. Watch these intra-day price action levels for your next signal.
 EUR/USD" title="EUR/USD" width="1096" height="868">
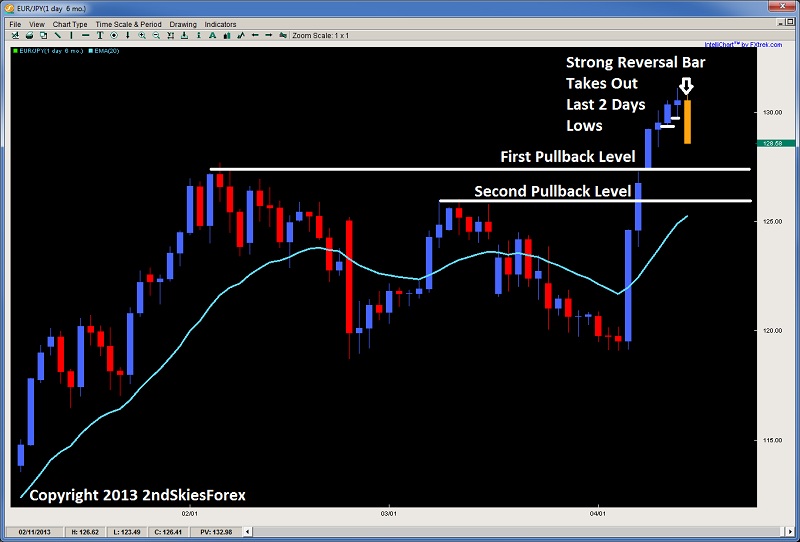
EUR/JPY
Forming a large impulsive selling bar to end last week, the EUR/JPY has taken out the last two days lows (almost a third), and likely triggered some stops and profit taking from the bulls. I actually anticipated this ahead of time, and blogged about it shortly before it happened.
This is likely to continue to start this week (barring new talk from the BOJ for more printing/QE-asing), and was also the first bear close in seven days.
Overall, the bull trend is quite in tact, so I’ll look for deeper breakout pullback levels to rejoin the uptrend, such as 127.63 and 126. Only a break below 124.42 would stunt the short term bullish outlook, and a break below 118.90 take out the medium term prospects of this strong bull trend. Upside targets are 134.42 and 138.39.
 EUR/JPY" title="EUR/JPY" width="1096" height="868">
Silver
On April 1, I mentioned a price action squeeze happening on the daily silver charts that should lead to a strong sell-off. The key level to be broken was the $28.00. The precious metal broke below as expected, and after selling off at about $1.45, reversed right back to the role reversal level at $28, offering a great setup to rejoin the trend. It literally only went 7 cents above $28, then sold off over $2.00, or 7% in the next 3 days, so hopefully you profited from that.
Weekly charts suggest a break below $26 sets up $25, and $23 and $20 as the major structure is turning heavily bearish, both short and medium term. I expect a possible small pop up higher this week; should $26 hold, but this is just an opportunity to sell for a medium term large bearish move. Look to sell at $28 and $29.50 (or a breakout pullback setup on a push below $26 which is a multi-year support), targeting the support levels mentioned.

Gold – Breaking Bad Edition
How can you not talk about the precious metal which got hammered losing over $78/oz on the day, crashing below the key multi-year support level at $1520 via the large breakout bar on Friday. This undoubtedly tripped stops from medium and long term bulls, and has now officially entered a primary “bear market” – which is simply a price decline of 20% over at least a two month period (Gold is down over 22% from the 2011 highs).
The PM may experience a short term pop, but consider any rallies towards $1496, $1520 and $1540 as selling opportunities, and places to watch for price action signals to get short.
Downside targets are minor support around $1479 and major support down at $1433.
NOTE: This sell off could be a the start of something major, which takes Gold towards $1337 and $1269 as the PM tends to historically under-perform from April to late June. Bottoms after moves like this are rarely formed in a day, and often take weeks or even months, so do not worry about catching a falling knife here. It will show signs of a bottom well before it actually does, so look for primarily shorts until we see some stronger basing, which may be a while.

Original post
Gaining three of the last 5 days, the short term bull run has ran into the key resistance level discussed in last week's market commentary at 1.3107, attempting to break it three times. Failing to do so, it has settled into a relative range between 1.3115 and 1.3037. A break above targets the 1.3254 area, while breaking down below 1.3037 will cause some profits to be taken and a likely further retracement towards 1.2948. Watch these intra-day price action levels for your next signal.
EUR/USD" title="EUR/USD" width="1096" height="868">EUR/JPY
Forming a large impulsive selling bar to end last week, the EUR/JPY has taken out the last two days lows (almost a third), and likely triggered some stops and profit taking from the bulls. I actually anticipated this ahead of time, and blogged about it shortly before it happened.
This is likely to continue to start this week (barring new talk from the BOJ for more printing/QE-asing), and was also the first bear close in seven days.
Overall, the bull trend is quite in tact, so I’ll look for deeper breakout pullback levels to rejoin the uptrend, such as 127.63 and 126. Only a break below 124.42 would stunt the short term bullish outlook, and a break below 118.90 take out the medium term prospects of this strong bull trend. Upside targets are 134.42 and 138.39.
EUR/JPY" title="EUR/JPY" width="1096" height="868">Silver
On April 1, I mentioned a price action squeeze happening on the daily silver charts that should lead to a strong sell-off. The key level to be broken was the $28.00. The precious metal broke below as expected, and after selling off at about $1.45, reversed right back to the role reversal level at $28, offering a great setup to rejoin the trend. It literally only went 7 cents above $28, then sold off over $2.00, or 7% in the next 3 days, so hopefully you profited from that.
Weekly charts suggest a break below $26 sets up $25, and $23 and $20 as the major structure is turning heavily bearish, both short and medium term. I expect a possible small pop up higher this week; should $26 hold, but this is just an opportunity to sell for a medium term large bearish move. Look to sell at $28 and $29.50 (or a breakout pullback setup on a push below $26 which is a multi-year support), targeting the support levels mentioned.
Gold – Breaking Bad Edition
How can you not talk about the precious metal which got hammered losing over $78/oz on the day, crashing below the key multi-year support level at $1520 via the large breakout bar on Friday. This undoubtedly tripped stops from medium and long term bulls, and has now officially entered a primary “bear market” – which is simply a price decline of 20% over at least a two month period (Gold is down over 22% from the 2011 highs).
The PM may experience a short term pop, but consider any rallies towards $1496, $1520 and $1540 as selling opportunities, and places to watch for price action signals to get short.
Downside targets are minor support around $1479 and major support down at $1433.
NOTE: This sell off could be a the start of something major, which takes Gold towards $1337 and $1269 as the PM tends to historically under-perform from April to late June. Bottoms after moves like this are rarely formed in a day, and often take weeks or even months, so do not worry about catching a falling knife here. It will show signs of a bottom well before it actually does, so look for primarily shorts until we see some stronger basing, which may be a while.
Original post