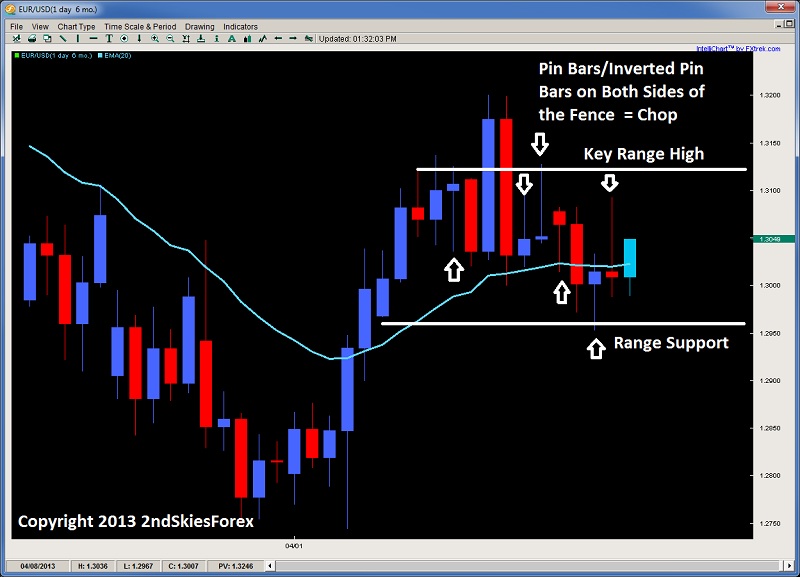
The chop continues as the Euro has not been able to string together more than 2 bull/bear days together without flipping sides. Although bias is slightly down, the pair has been staging a series of false breaks and pin bars galore. That many pin bars do not occur normally, unless we have incredible indecision going on.
With the strong closing on Friday, I’m expecting the pair to test the upper part of the range towards 1.3115 which we commented on in last week's commentary – and many of our traders profited from selling here. This is the upside key level to watch for intra-day price action signals on the 1hr chart and below. Bulls have to maintain 1.2950 to keep any semblance of a bullish bias. EUR/USD" title="EUR/USD" width="1280" height="845">
USD/JPY
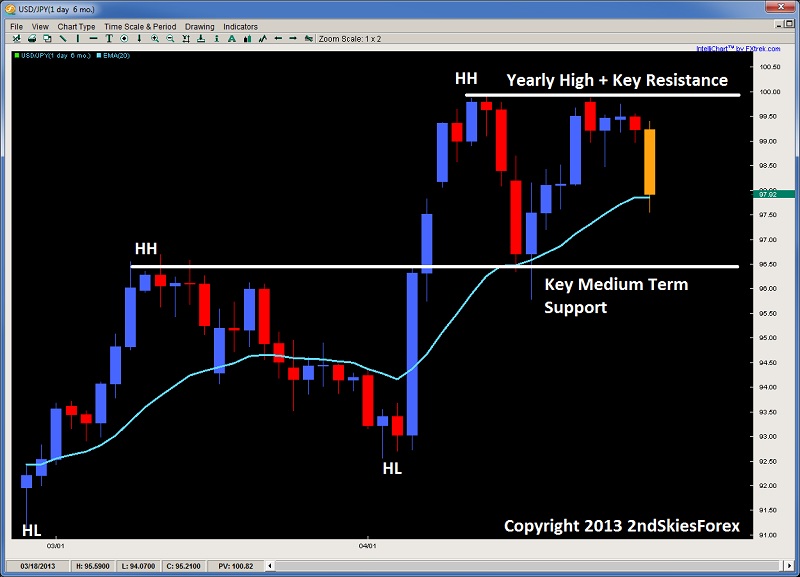
Having failed twice to take out the 100 barrier, the USD/JPY sold off aggressively on Friday. The pair managed to barely hold onto the dynamic support and daily 20ema but looks to be under pressure. Although the uptrend is still in play, the key level for bears to take out will be the 96.54 which was the March 12′ swing high, and support on the last bounce. Bulls can look to get in around here, with stops below the April 16th lows, targeting the range highs. Bears on the other hand can look for a corrective pullback towards 99.75, or a breakout below the key support level below. USD/JPY" title="USD/JPY" width="1280" height="845">
Crude Oil
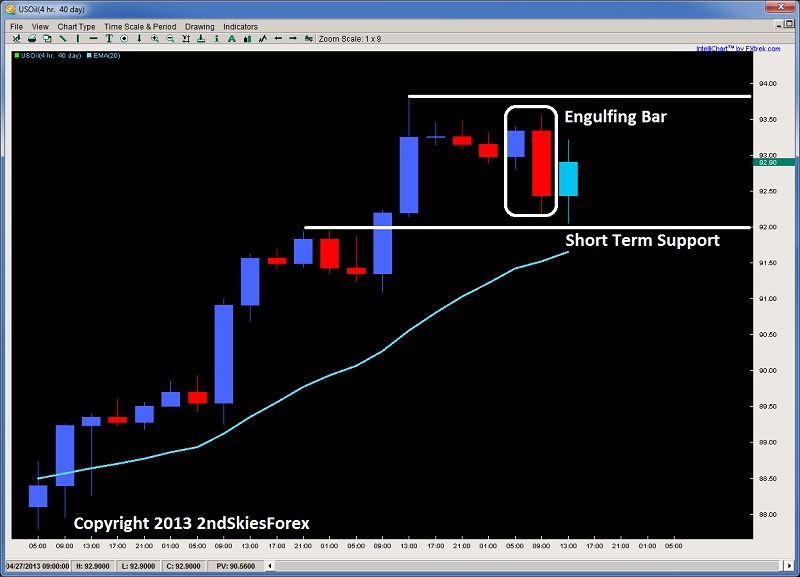
Last week on my Thursday Market Commentary, I discussed the inside bar setup, and mentioned I was seeing more upside, but watching for a pullback towards $91.95. The commodity formed a bearish engulfing bar suggesting possible pullback. But the price action selling ran into the $92 level and found buyers. If the selling was legitimate, where did all the sellers go, and why did the selling evaporate? Inquiring minds want to know.
I’m not convinced the sellers have control of the market, and think the bulls are going to take another attempt to break the $93.84 swing high. Downside support comes in at $92, and if this breaks, I’ll expect further selling towards $89.50. An upside break targets $94.50 and $95.75.
Gold
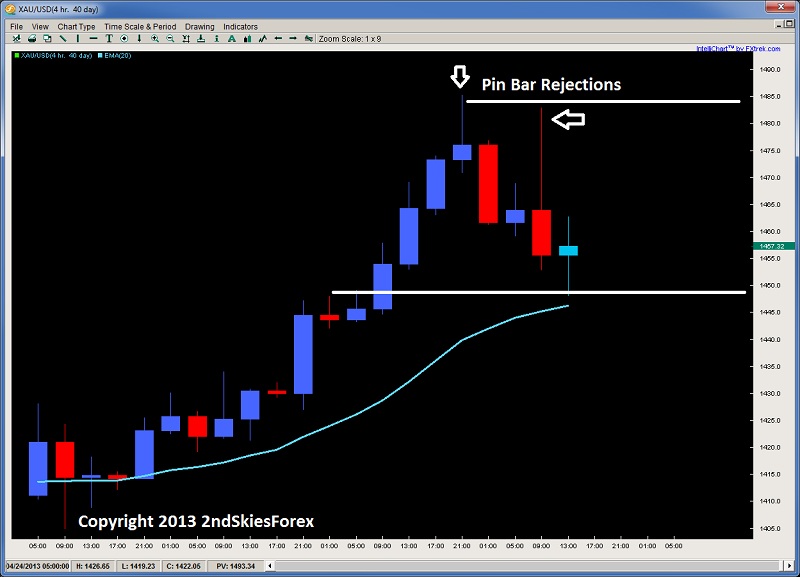
After making up some of the massive losses it took on 14 days ago, the PM ran into the key role reversal level at $1484, going one dollar past, and then forming a 4hr pin bar setup. The pair sold off heavily from this, and then took a second stab at the level, forming another long tailed pin bar, coming just shy of the level and falling over $25 in a couple hours, so obviously sellers were willing to defend the level for now.
The shiny metal found support around $1448, so the lines are drawn short term. Bulls have to take out $1485 near term while bears have the $1448 level in sights. Physical demand has been through the roof, so this may underpin the paper prices, but the line of least resistance for the short term is still to the downside.
Original post
- English (UK)
- English (India)
- English (Canada)
- English (Australia)
- English (South Africa)
- English (Philippines)
- English (Nigeria)
- Deutsch
- Español (España)
- Español (México)
- Français
- Italiano
- Nederlands
- Português (Portugal)
- Polski
- Português (Brasil)
- Русский
- Türkçe
- العربية
- Ελληνικά
- Svenska
- Suomi
- עברית
- 日本語
- 한국어
- 简体中文
- 繁體中文
- Bahasa Indonesia
- Bahasa Melayu
- ไทย
- Tiếng Việt
- हिंदी
Weekly Forex Price Action: April 28 – May 3, 2013
Published 04/28/2013, 01:48 AM
Updated 05/14/2017, 06:45 AM
Weekly Forex Price Action: April 28 – May 3, 2013
EURUSD
Latest comments
Loading next article…
Install Our App
Risk Disclosure: Trading in financial instruments and/or cryptocurrencies involves high risks including the risk of losing some, or all, of your investment amount, and may not be suitable for all investors. Prices of cryptocurrencies are extremely volatile and may be affected by external factors such as financial, regulatory or political events. Trading on margin increases the financial risks.
Before deciding to trade in financial instrument or cryptocurrencies you should be fully informed of the risks and costs associated with trading the financial markets, carefully consider your investment objectives, level of experience, and risk appetite, and seek professional advice where needed.
Fusion Media would like to remind you that the data contained in this website is not necessarily real-time nor accurate. The data and prices on the website are not necessarily provided by any market or exchange, but may be provided by market makers, and so prices may not be accurate and may differ from the actual price at any given market, meaning prices are indicative and not appropriate for trading purposes. Fusion Media and any provider of the data contained in this website will not accept liability for any loss or damage as a result of your trading, or your reliance on the information contained within this website.
It is prohibited to use, store, reproduce, display, modify, transmit or distribute the data contained in this website without the explicit prior written permission of Fusion Media and/or the data provider. All intellectual property rights are reserved by the providers and/or the exchange providing the data contained in this website.
Fusion Media may be compensated by the advertisers that appear on the website, based on your interaction with the advertisements or advertisers.
© 2007-2025 - Fusion Media Limited. All Rights Reserved.
