GBPUSD – Pin Bars @ Resistance
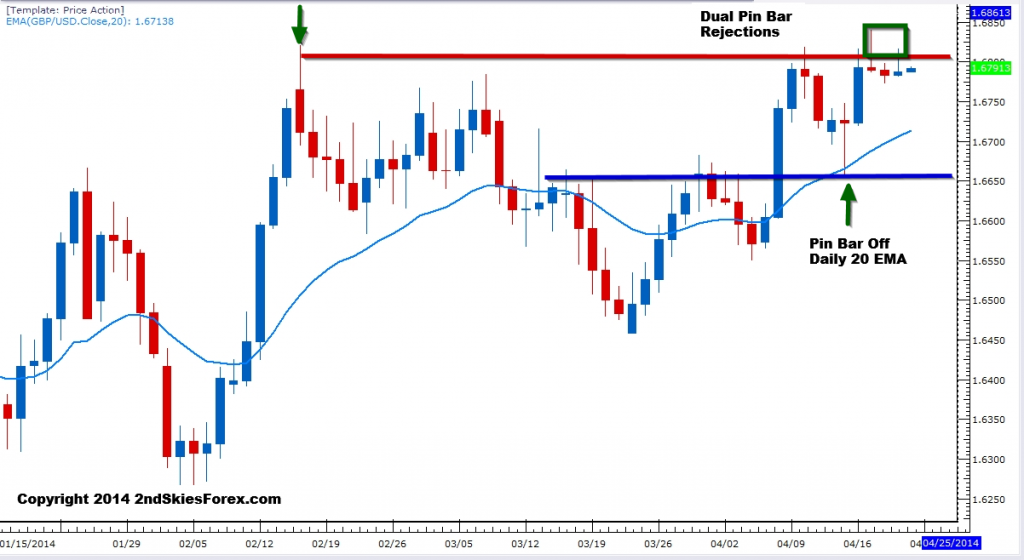
While the Euro continues to be the sleepiest major out there, the GBPUSD has been more active, pressing up against the yearly resistance level at 1.6820 that we talked about in the April 16th commentary. In the last three days, the pair has formed two pin bars, with the second one being smaller than the first.
Considering the price action has been mostly contained near resistance, this would suggest a likely break to the upside, since no real sellers are pushing back. The daily 20 EMA and dynamic support has held the downside the last time, so pullbacks to this area can be good signals to get long (~1.6700/6660) with stops below 1.6640. Upside targets can be 1.6812, and 1.6860, which is just shy of the Nov 09′ resistance at 1.6877.
Gold – Showing Some Two-Way Interest
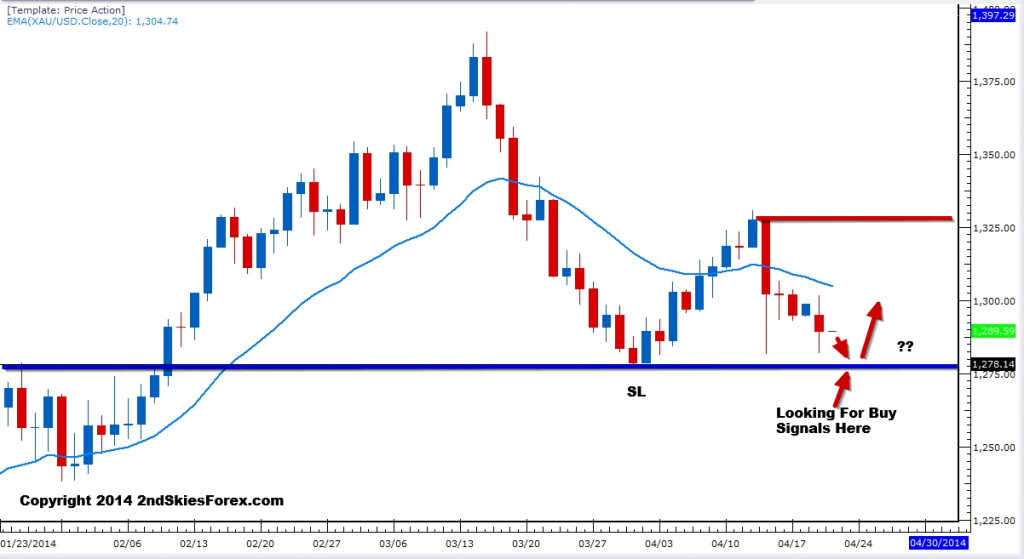
After the dramatic sell-off from last week, the PM has been mostly confined to the 1304 – 1281 range, with the lower level being the bottom of the mini-flash crashed I talked about last week.
Today’s price action (to be taken with a grain of salt due to low volumes) showed rejection on both sides of the market, suggesting more two-way interest.
Bulls can look for potential basing around 1278, which is the SL (swing low) from late March this year. Look for price action signals here to potentially get long, targeting 1294, 1300, and potentially a return to 1325. A daily close below here suggests more bearish-ness, and an attack on 1250 and 1238.
Dow Jones – Heading Towards Key Resistance Zone
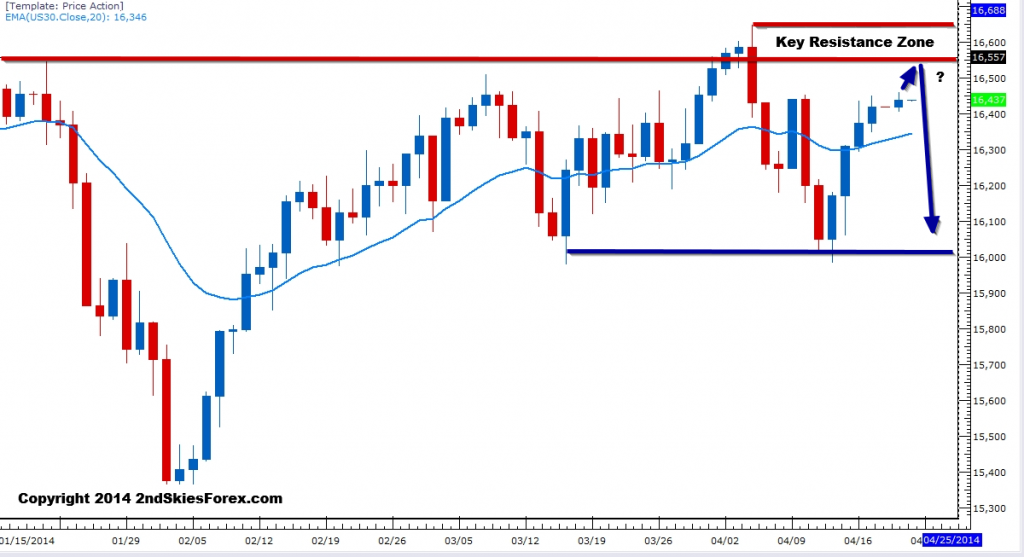
Moving into a key resistance zone and all time highs, the US index has now closed 5 days in a row bullish. Even though the trend is clearly bullish long term, medium term we’ve been in a range between 16000 and 16600.
There could be an opportunity to sell at the resistance levels assuming some bulls take profit ahead of them. Look for price action signals to get short between 16,550, and 16,650. A daily close above the all time highs will put pressure on 16.8K and 17K.
Original post
- English (UK)
- English (India)
- English (Canada)
- English (Australia)
- English (South Africa)
- English (Philippines)
- English (Nigeria)
- Deutsch
- Español (España)
- Español (México)
- Français
- Italiano
- Nederlands
- Português (Portugal)
- Polski
- Português (Brasil)
- Русский
- Türkçe
- العربية
- Ελληνικά
- Svenska
- Suomi
- עברית
- 日本語
- 한국어
- 简体中文
- 繁體中文
- Bahasa Indonesia
- Bahasa Melayu
- ไทย
- Tiếng Việt
- हिंदी
Weekly Forex Price Action Market Commentary
Published 04/22/2014, 01:12 AM
Weekly Forex Price Action Market Commentary
Latest comments
Loading next article…
Install Our App
Risk Disclosure: Trading in financial instruments and/or cryptocurrencies involves high risks including the risk of losing some, or all, of your investment amount, and may not be suitable for all investors. Prices of cryptocurrencies are extremely volatile and may be affected by external factors such as financial, regulatory or political events. Trading on margin increases the financial risks.
Before deciding to trade in financial instrument or cryptocurrencies you should be fully informed of the risks and costs associated with trading the financial markets, carefully consider your investment objectives, level of experience, and risk appetite, and seek professional advice where needed.
Fusion Media would like to remind you that the data contained in this website is not necessarily real-time nor accurate. The data and prices on the website are not necessarily provided by any market or exchange, but may be provided by market makers, and so prices may not be accurate and may differ from the actual price at any given market, meaning prices are indicative and not appropriate for trading purposes. Fusion Media and any provider of the data contained in this website will not accept liability for any loss or damage as a result of your trading, or your reliance on the information contained within this website.
It is prohibited to use, store, reproduce, display, modify, transmit or distribute the data contained in this website without the explicit prior written permission of Fusion Media and/or the data provider. All intellectual property rights are reserved by the providers and/or the exchange providing the data contained in this website.
Fusion Media may be compensated by the advertisers that appear on the website, based on your interaction with the advertisements or advertisers.
© 2007-2025 - Fusion Media Limited. All Rights Reserved.
