US Dollar Fundamental Analysis:
The surge in risk appetite after the result of the French election put the US dollar on the defensive at the beginning of the week because of its safe haven status. The USD appreciates during uncertain bad times and it depreciates during positive “good times”.
Last week’s US economic data was not great and it remains for us to see how the economy is doing going forward. There is certainly some slowdown as of recently but if the decline doesn’t persist then no notable USD correction should happen. However, if weak data continues to come in then the US dollar will have further to fall on a broad basis.
Notably, core durable goods orders on Thursday and the advance GDP on Friday will be released this week.
EUR/USD:
Fundamentals
No surprises in the French Presidential election, and in fact polls predicted the result just right with Emanuel Macron ending the election with a slight lead over far-right Marine Le Pen. The euro jumped higher at the open as investors are now betting that Macron will win the second round and the risk of Frexit has been evaded.
The positive effect of the election result should last in EUR/USD, meanwhile all focus this week will be on the ECB press conference and interest rate decision. The bullish or bearish bias of President Draghi on the press conference will determine whether EUR/USD continues its rally or give back some of the gains.
Technicals
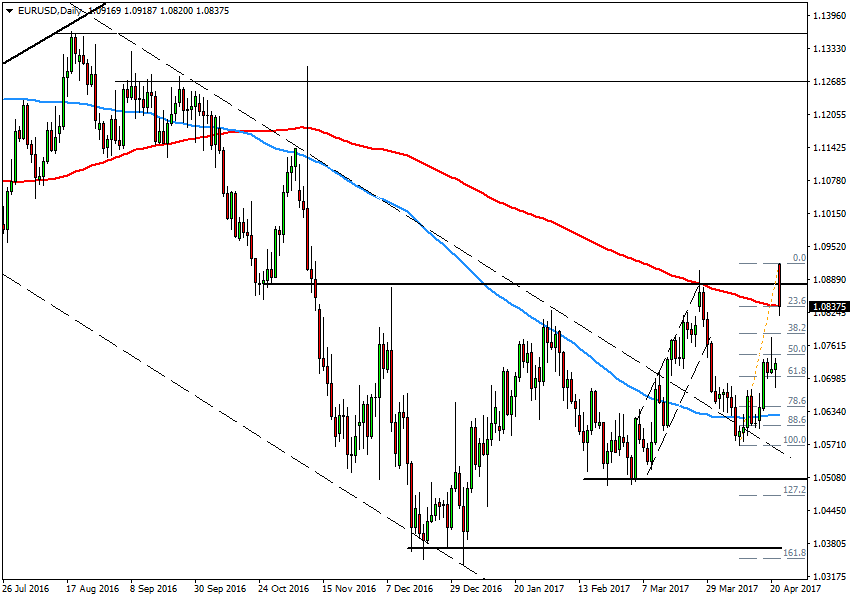
EUR/USD opened almost 200 pips higher and although the pair gave up some of those gains the whole 200-pip gap is unlikely to be fully filled. With that in mind, EUR/USD should start to cripple higher again. Note, however, that it’s unlikely that a sharp move higher will occur, but rather a gradual range-bound crippling higher is a more likely scenario.
The 200-day moving average at 1.0835 (red line) should now act as support. Below it there is support at 1.0784 (39.2% Fibonacci retracement).
To the upside, the first resistance is at 1.0990 - 1.10 (Fibonacci confluence) and then the highs around 1.12.

EUR/USD Daily chart – Opened above key technical resistance levels
GBP/USD:
Fundamentals
The surprise announcement of a snap election from UK Prime Minister Theresa May was the main theme among FX traders last week. GBP/USD rallied 300 pips in a matter of hours after the speech of the Prime minister as traders view the elections to give the UK a stronger hand in the Brexit negotiation process with the European Union, and even to some degree the market is probably pricing in a softer Brexit.
No major economic releases are lined up until Friday’s preliminary GDP and that suggests the uptrend from last week has room to continue to move higher.
Technicals
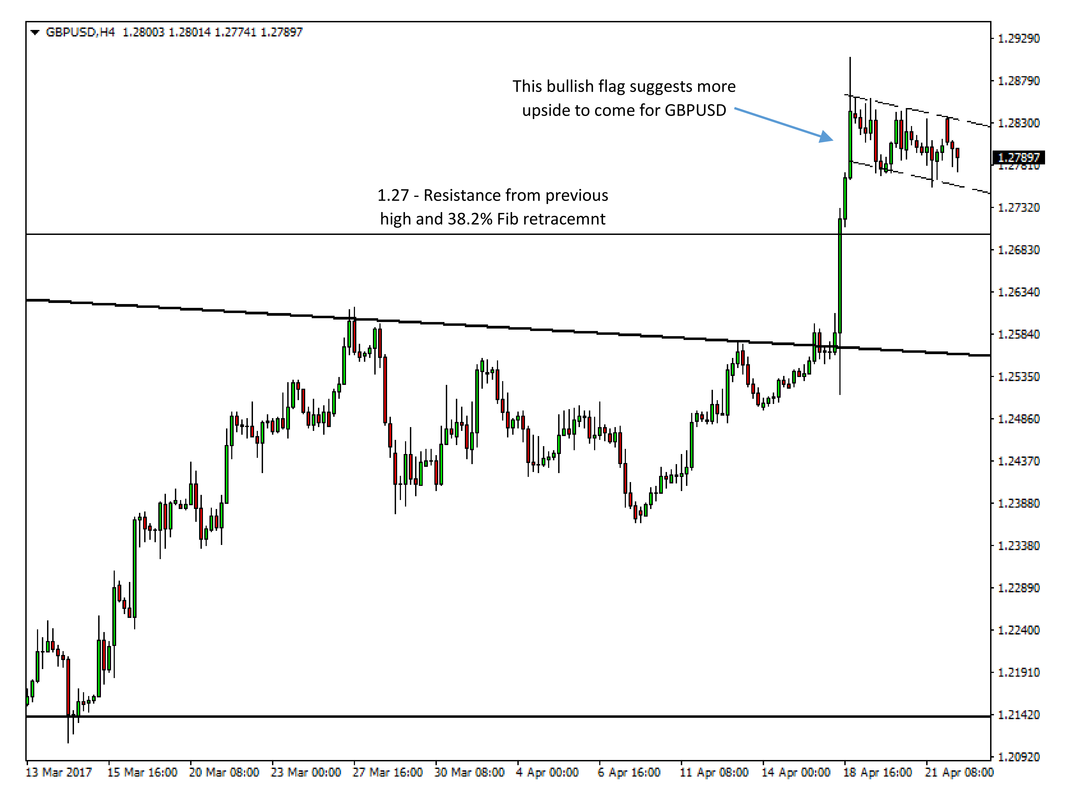
GBP/USD broke through major resistance levels on the daily and weekly charts last week. Most importantly it broke the neckline and with that confirmed the bullish inverted head and shoulders pattern we showed last week (for the chart refer to last week’s analysis here).
The bullish flag that GBP/USD has been trading in since Tuesday suggests that the uptrend will resume sooner or later.
Support to the downside is the lower trendline of the flag (currently 1.2750) and then 1.27 which is a 38.2% Fibonacci retracement of the latest upswing.
The first resistance to the upside is at 1.30, and then 1.33 - 1.34.
GBP/USD 4h chart - A bullish flag in play
USD/JPY:
Fundamentals
The Japanese yen suffered on the Sunday’s market open due to its safe haven status amid the positive result of the French election. USD/JPY opened the day 150 pips higher, though the pair has recovered some of the losses after a few hours.
Thursday’s Bank of Japan meeting and the subsequent press conference are the pivotal event of the week for the yen. While no change in policy is expected, a slight tilt of the tone to the dovish or hawkish side can send the Japanese currency on a wild ride.
The BOJ’s stance is already heavily dovish so more dovishness should not weaken the JPY significantly.
Technicals
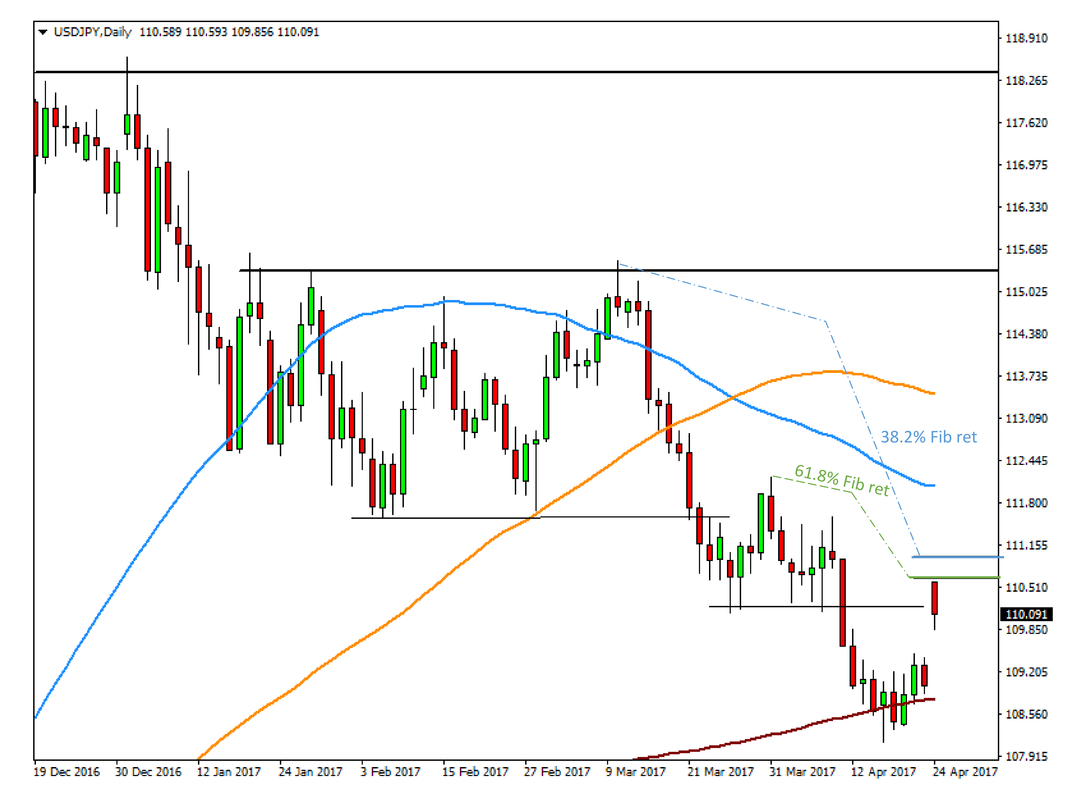
USD/JPY also opened above key resistance levels, notably above the 110 level. Whether it holds above it or not will give us important implications about the future trend in USD/JPY.
The pair has declined since the open right from the confluence Fibonacci resistance zone at 110.60 – 110.95 (the 2 levels are shown on the chart). If USD/JPY goes through it the next resistance would be 112.
To the downside, support is at the previous high at 109.50.
USD/JPY Daily chart - At Fibonacci resistance


