The EUR/USD finished sharply lower to end the week as investors reacted to the rise in Spanish debt yields to their highest levels in months and to weak data on U.S. consumer sentiment. Disappointing news regarding Chinese economic growth also underpinned the Greenback.
While the weaker-than-expected China GDP data may have been the catalyst for the dollar’s early strength against the Euro, the main driver of the weakness in the EUR/USD was the rise in yields in Spain. Yields on Spain’s 10-year debt rose back to 5.95%, their highest level since November. Traders drove up yields after learning about significantly increased borrowing by Spanish banks from the European Central Bank.
Developments in Spain are expected to be watched closely due to the size of its economy. This means that Euro Zone officials may have to come up with more creative ways to shore up its finances because an outright bailout may not be possible.
In the meantime, traders are looking for the ECB to continue to purchase Spanish debt, but at some point this buying may dry up as the central bank begins to question its own actions. With yields also rising in Italy, the ECB may be forced to decide which country gets the most attention. The commitment to austerity may be the deciding factor as too which country becomes the favored nation.
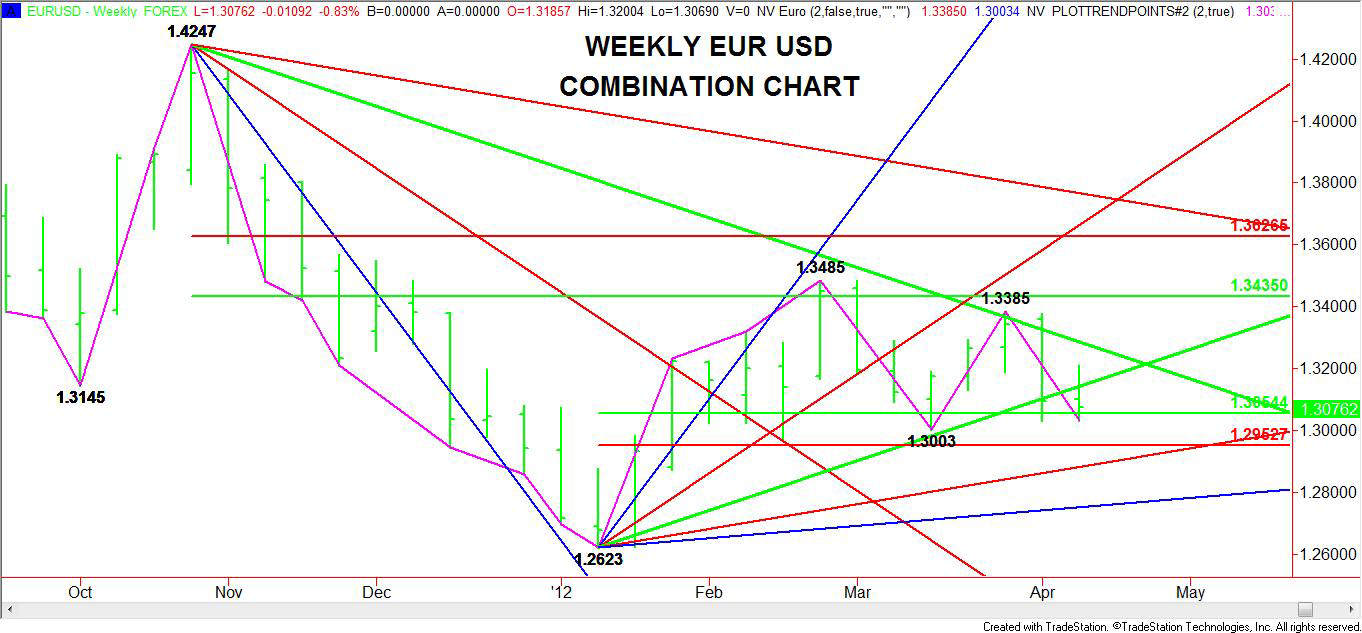
Technically, the weekly outlook for the EUR/USD looks bearish. The Weekly EUR/USD Combination Chart (Fig. 1) may look confusing, but the combination of Gann angles, retracement levels and swing points all indicate a bias to the downside. Let’s breakdown the main components of this market that support this assessment.
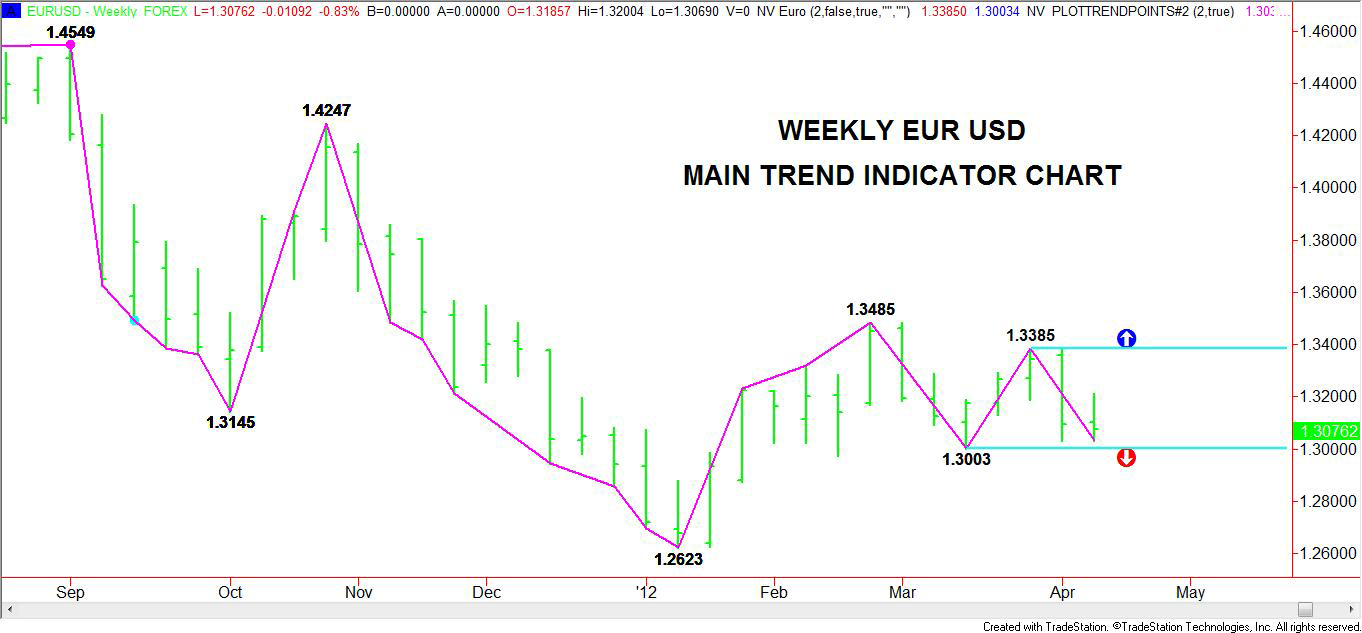
The Weekly EUR/USD Main Trend Indicator Chart (Fig. 2) measures the 2-bar swings in the market. The main trend is down based on the series of lower-tops and lower-bottoms. Even though the market appears to be going through a transition period since bottoming at 1.2623 in January, it hasn’t crossed any main tops and appears to be in a position to take out a bottom at 1.3003. This action would be further evidence that it is headed lower.
On the upside, a trade through 1.3385 will be a sign of developing strength, but to be safe a move through the main top at 1.3485 will be a more dependable indication that the trend is turning to up in the EUR/USD.
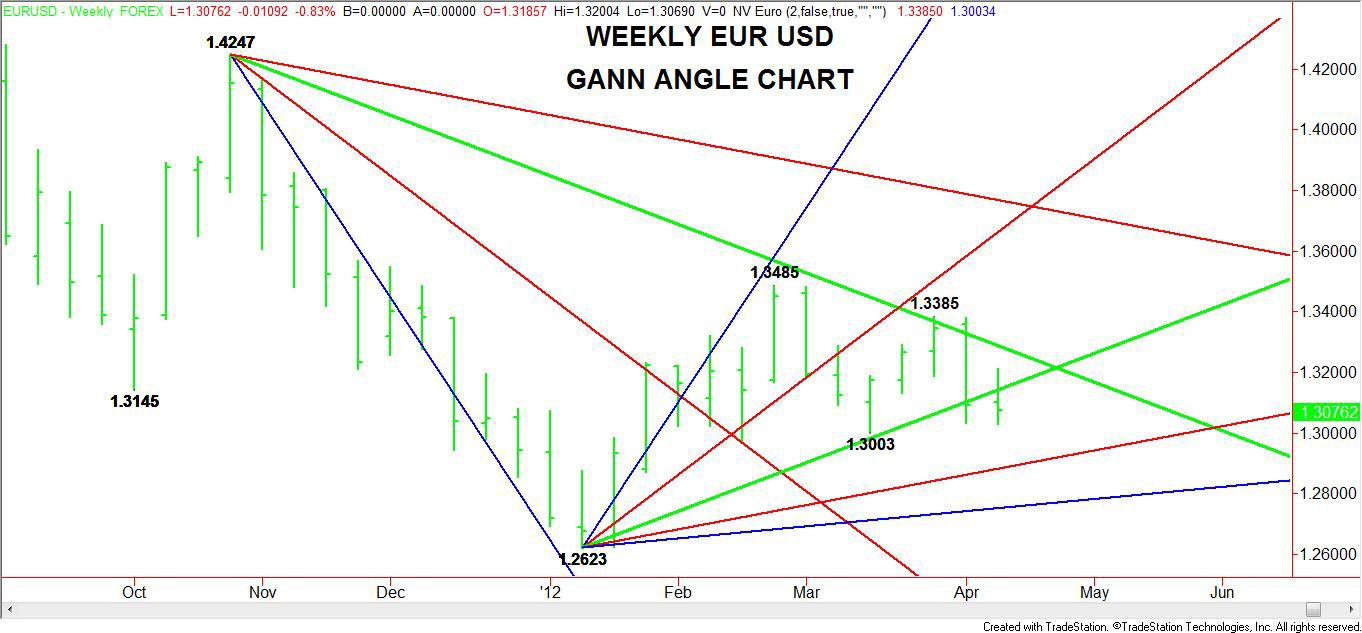
While the main swing chart focuses on the 2-bar tops and bottoms or horizontal support and resistance levels, the Weekly EUR/USD Gann Angle Chart zeroes in on the diagonal movement.
This chart suggests that the resistance is at the downtrending Gann angle from the 1.4247 top. This angle has stopped the rallies two out of the last three weeks. For the week-ending April 20, this resistance angle is at 1.3247.
Taking the two angles together, one can see a triangle chart pattern. The triangle chart pattern is a non-trending pattern. The gradual compression of the price ranges typically means impending volatility. The breakdown through the support line of the triangle indicates selling pressure. Now all that is needed to drive the market lower is rising volume and increased volatility. This may not occur, however, until the swing bottom at 1.3003 is violated.
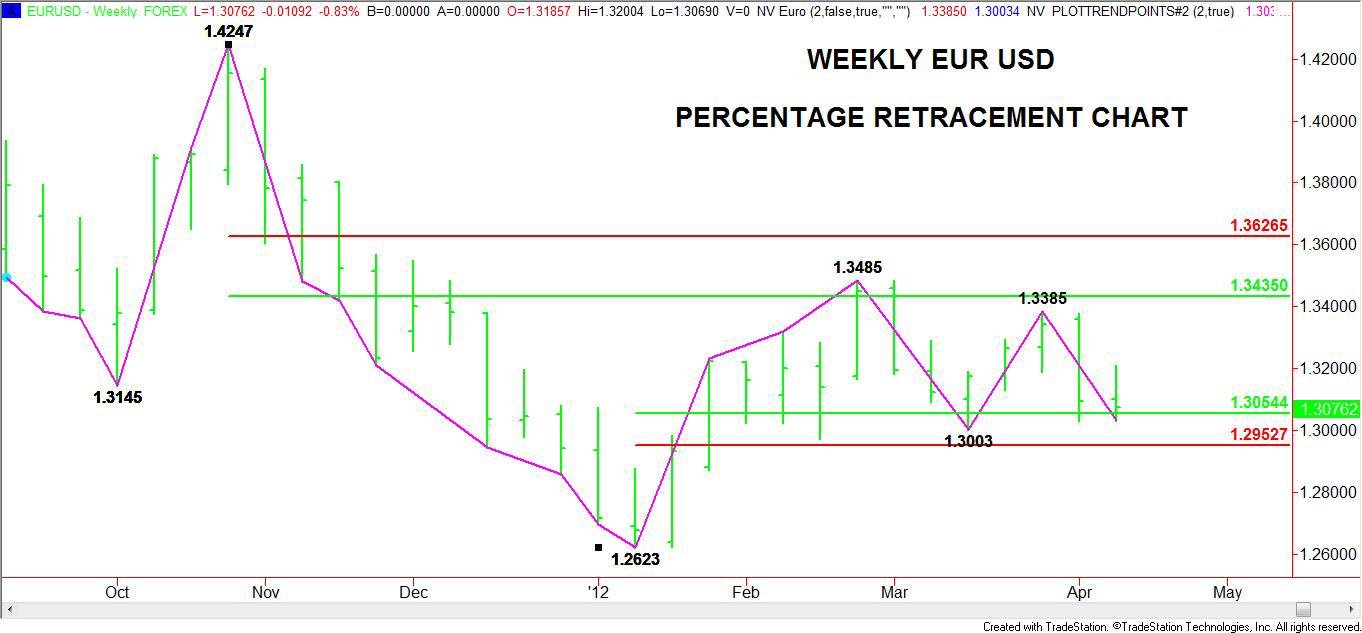
Besides the main trend indicator chart, the percentage retracement chart also indicates horizontal support and resistance levels. Based on the main range of 1.4247 to 1.2623, the major 50% to 61.8% retracement zone is 1.3435 to 1.3626. The 50% retracement level stopped two rallies at 1.3485 and 1.3385. This makes it a key resistance level. When combined with the two swing tops, a breakout above this level will not only indicate the main trend has turned up, but could also trigger an acceleration to the upside.
On the downside, the short-term range is 1.2623 to 1.3485. This range has created a retracement zone at 1.3054 to 1.2953. This area has been providing the support. Recently, the 50% level at 1.3054 has been tested twice and may be ready to give way. If the EUR/USD trades down to the Fibonacci level at 1.2953, this will mean the main swing bottom at 1.3003 will have been broken. This action should put the Euro in a weak position.
Putting it all together, it is pretty clear that the main trend is down in the EUR/USD and that this currency pair may be setting up for a sharp break. The key price level to watch is 1.3003 as this number turns up on all three technical strategy charts. Stops may be building under this level and shorts may be ready to press the market through this point. Although bottom-pickers may continue to come into the market, this should only serve to slow down the break. Sentiment appears to be on the side of the short-traders and shouldn’t change unless the swing top at 1.3385 is violated.
- English (UK)
- English (India)
- English (Canada)
- English (Australia)
- English (South Africa)
- English (Philippines)
- English (Nigeria)
- Deutsch
- Español (España)
- Español (México)
- Français
- Italiano
- Nederlands
- Português (Portugal)
- Polski
- Português (Brasil)
- Русский
- Türkçe
- العربية
- Ελληνικά
- Svenska
- Suomi
- עברית
- 日本語
- 한국어
- 简体中文
- 繁體中文
- Bahasa Indonesia
- Bahasa Melayu
- ไทย
- Tiếng Việt
- हिंदी
Weekly EUR/USD Chart Pointing Lower
Published 04/16/2012, 02:14 AM
Updated 05/14/2017, 06:45 AM
Weekly EUR/USD Chart Pointing Lower
Latest comments
Loading next article…
Install Our App
Risk Disclosure: Trading in financial instruments and/or cryptocurrencies involves high risks including the risk of losing some, or all, of your investment amount, and may not be suitable for all investors. Prices of cryptocurrencies are extremely volatile and may be affected by external factors such as financial, regulatory or political events. Trading on margin increases the financial risks.
Before deciding to trade in financial instrument or cryptocurrencies you should be fully informed of the risks and costs associated with trading the financial markets, carefully consider your investment objectives, level of experience, and risk appetite, and seek professional advice where needed.
Fusion Media would like to remind you that the data contained in this website is not necessarily real-time nor accurate. The data and prices on the website are not necessarily provided by any market or exchange, but may be provided by market makers, and so prices may not be accurate and may differ from the actual price at any given market, meaning prices are indicative and not appropriate for trading purposes. Fusion Media and any provider of the data contained in this website will not accept liability for any loss or damage as a result of your trading, or your reliance on the information contained within this website.
It is prohibited to use, store, reproduce, display, modify, transmit or distribute the data contained in this website without the explicit prior written permission of Fusion Media and/or the data provider. All intellectual property rights are reserved by the providers and/or the exchange providing the data contained in this website.
Fusion Media may be compensated by the advertisers that appear on the website, based on your interaction with the advertisements or advertisers.
© 2007-2025 - Fusion Media Limited. All Rights Reserved.
