Investing.com’s stocks of the week
Canada – In September, the Teranet–National Bank National Composite House Price Index™ rose 0.8% over the previous month. This was the second largest September increase since the index’s inception in 1999. Prices were up in six of the eleven regions covered: Toronto (+2.2%), Hamilton (+1.4%), Victoria (+1.1%), Calgary (+0.3%), Vancouver (+0.2%) and Winnipeg (+0.1%). They were stable in Halifax and declined in Edmonton (-0.4%), Ottawa-Gatineau (-0.6%), Montreal and Quebec City (-0.8% respectively).
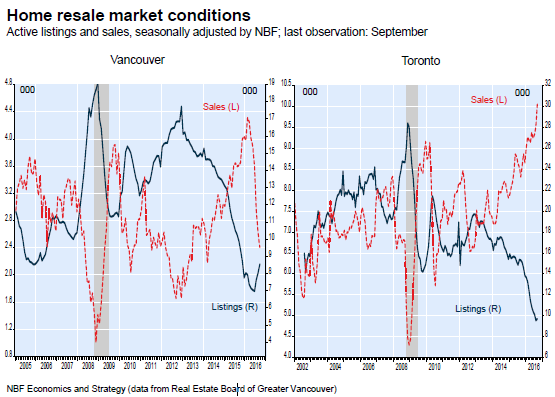
Year over year, the national index sprang 11.7%, its steepest 12-month jump since June 2010. Leading the charge were Vancouver (+24.0%), Victoria (+17.9%), Toronto (+16.4%) and Hamilton (+13.1%), followed at a good distance by Winnipeg (+4.6%), Ottawa-Gatineau (+0.9%) and Montreal (+0.2%). Prices were down from a year earlier in Edmonton (−0.7%), Halifax (-0.9%), Quebec City (−2.0%) and Calgary (−4.9%). In Vancouver, after seven hefty monthly increases in a row, prices were virtually flat m/m. This was consistent with a recent loosening of the resale market. Indeed, since hitting an all-time high last February, sales have dropped month after month for a cumulative decline of 44%.have combined there to lift monthly price growth to 2.9% on average over the past four months.

Again in September, housing starts rose at an annual rate of 19.7% to 220.6K. In urban areas, multiple starts were up 25.1K (+22.3%) to 137.8K, and single-detached starts increased 8.1K (+14.4%) to 64.0K. In rural areas, starts were estimated at 18.8K units, up 3.1K (+20.4%). On a regional basis, starts increased sharply in British Columbia (+13.4K), Quebec (+13.1K), Alberta (+9.3K), Nova Scotia (+3.0K) and New Brunswick (+2.0K). They progressed at a much slower pace in Manitoba (+0.3K) and fell in the other provinces: Ontario (-2.8K), Saskatchewan (-1.7K), Prince Edward Island (-0.1K) and Newfoundland and Labrador (-0.1K). Following September’s surge, starts in Q3 were up an annualized 4.2% over Q2. They thus contributed to economic growth in the quarter, especially as they were tilted towards single-family homes, which were up 7.3%.
To read the entire report Please click on the pdf File Below
