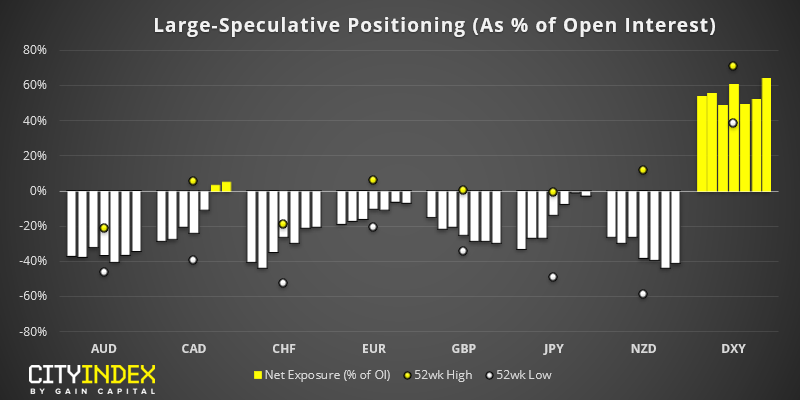
As of Tuesday 15th July 2019:
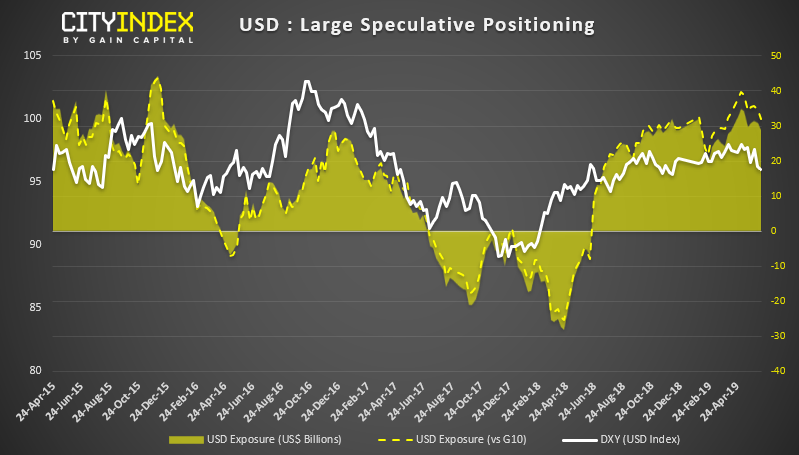
- Traders were net-long USD $12.38 billion ($16.95 against G10 currencies), up by $0.1 billion to snap a five-week streak of long reduction
- Large speculators have been net-long CAD for two consecutive weeks, and at their most bullish level since March 2018
- Traders are the most bearish on GBP since August 2018
- NZD bulls trimmed gross long positions for s seventh consecutive week
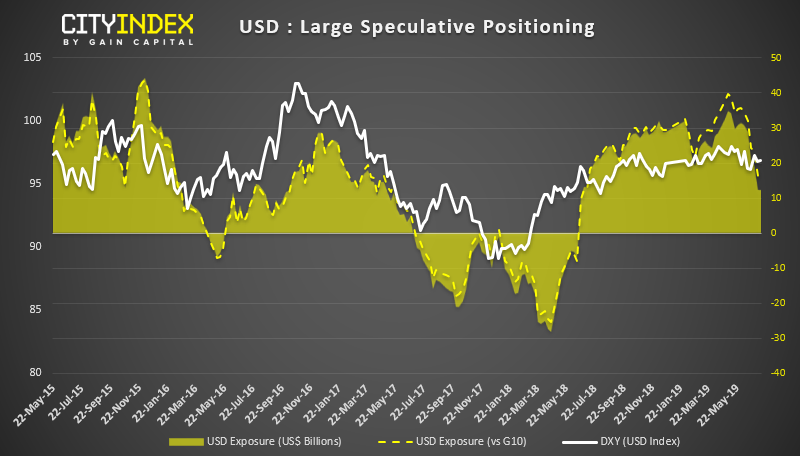
USD: Traders have reduced long exposure to USD by -59.8% (or $17.4 billion) over the past 8 weeks, which around their least bullish exposure since January 2018. In dollar terms, traders are the most bearish against GBP and EUR, and currently long by $5.7 and $5.0 billion USD respectively.
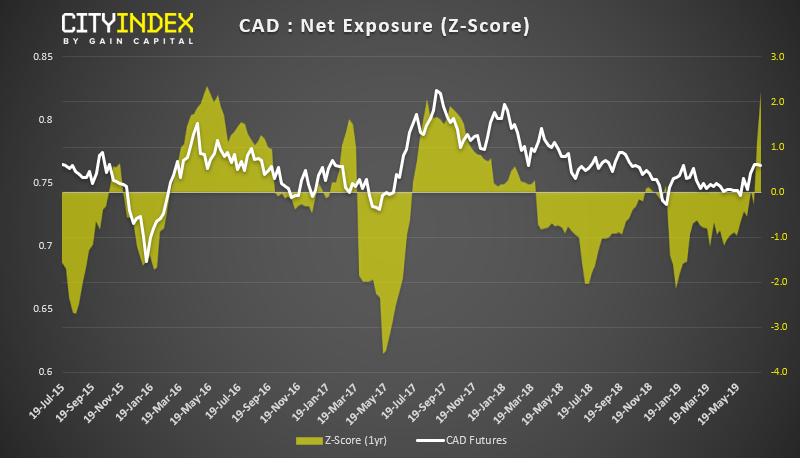
CAD: Traders have been net-long CAD for two weeks, breaking a 50-week streak of net-short exposure. Whilst short-covering has subsided, gross longs increased for a third week and are now at their highest level this year. However, CAD’s 1-year Z-Score has spiked above +2 standard deviations to warn of exhaustion. Historically, this has coincided (thereabouts) with a top in CAD futures. Whilst this does not guarantee a reversal (especially since positioning is anything but over-extended) it is something to keep in mind going forward.
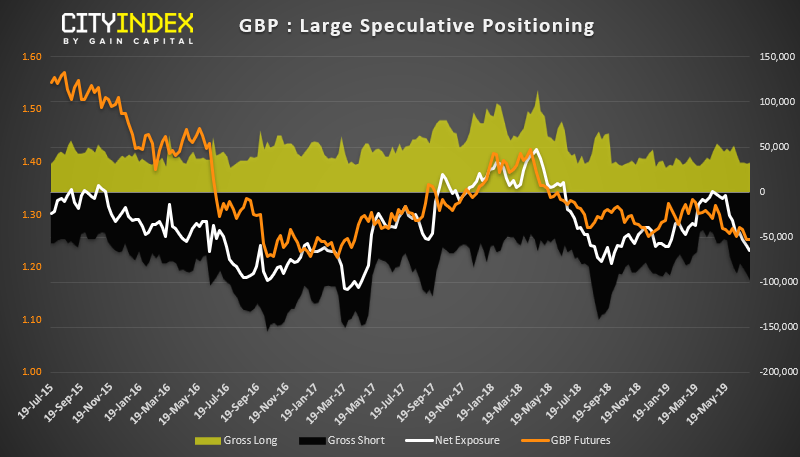
GBP: It’s up for debate as to whether we’re at a sentiment extreme. Traders are net-short -80k contracts, similar to levels in September 2018 when bearish exposure troughed. However, by historical standards, GBP has been over 100k contracts short before hitting a reversal and with politics continuing to weigh on Sterling, we’re not confident enough to say it can’t go down further. Gross shorts are currently at -109k but we’ve seen traders short by -150k before a reversal. Perhaps this is not a trend with fighting just yet.
JPY: Last week traders were on the cusp of flipping to net-long exposure, at just -1.3k contracts net-short exposure. However, bearish exposure has increased with +3.6k long contracts initiated, and the 1-year Z-score is +2.15 standard deviations to suggest it could be reaching an inflection point. If so, we could see net-short exposure increase which could imply a period of risk-on awaits. We’d need to see USD/JPY break above 109.02 to confirm.
As of Tuesday 15th July 2019:
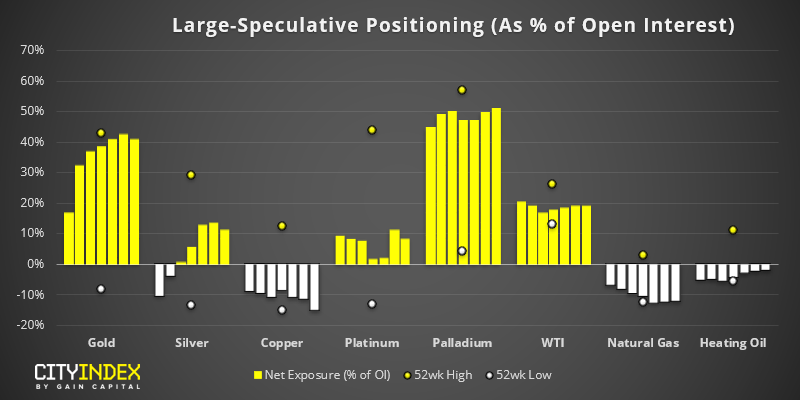
- Net-long exposure for gold declined for the first time in five weeks
- Bullish exposure for WTI was trimmed by -2.6k contracts
- Traders were their most bearish on copper since April 2018
- Large speculators are their most bullish on palladium in 4 months
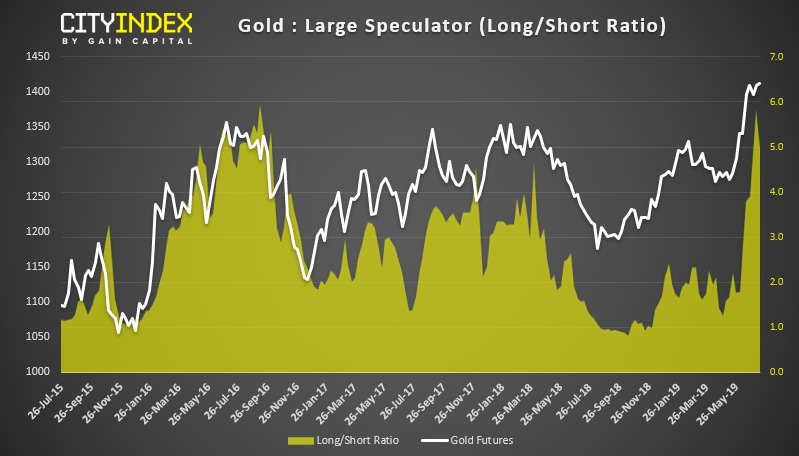
Gold: Sentiment remains overwhelmingly bullish for gold. And by some measures, perhaps too bullish. There are currently 4.9 longs to every short, similar to levels seen mid-2016 when gold prices topped out. And its 1-year Z-score is +2.45 standard deviations, again last seen around mid-2016 when prices topped out. Whilst the core bias is bullish for gold, we suspect we need to ride out a retracement first. And looking at how volatility has risen around the $1400 area, we’d suggest caution around current levels until prices suggest a higher low has formed.
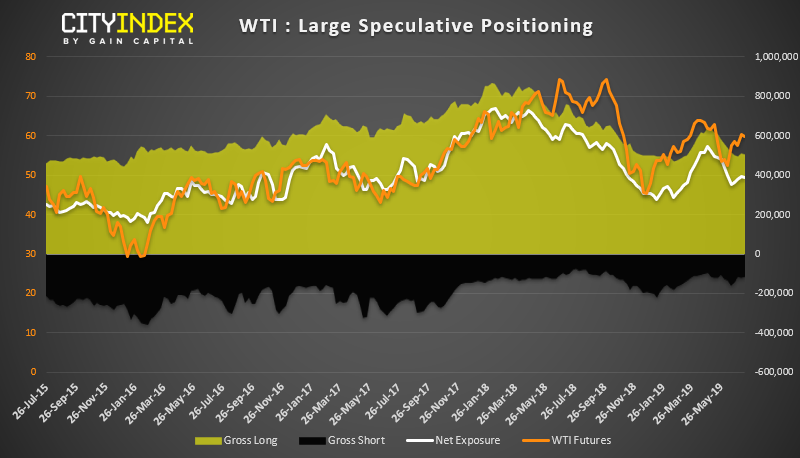
WTI: Net-long exposure was trimmed by -7.5k contracts. Over the past 11 weeks, net-long exposure has been trimmed 10 of them, which is hardly a compelling bull-case. Whilst there are still 4.4 longs to every short, we’re not seeing fresh longs initiated to support a bullish theme, meaning out bias leans towards choppy price action over the near-term.
