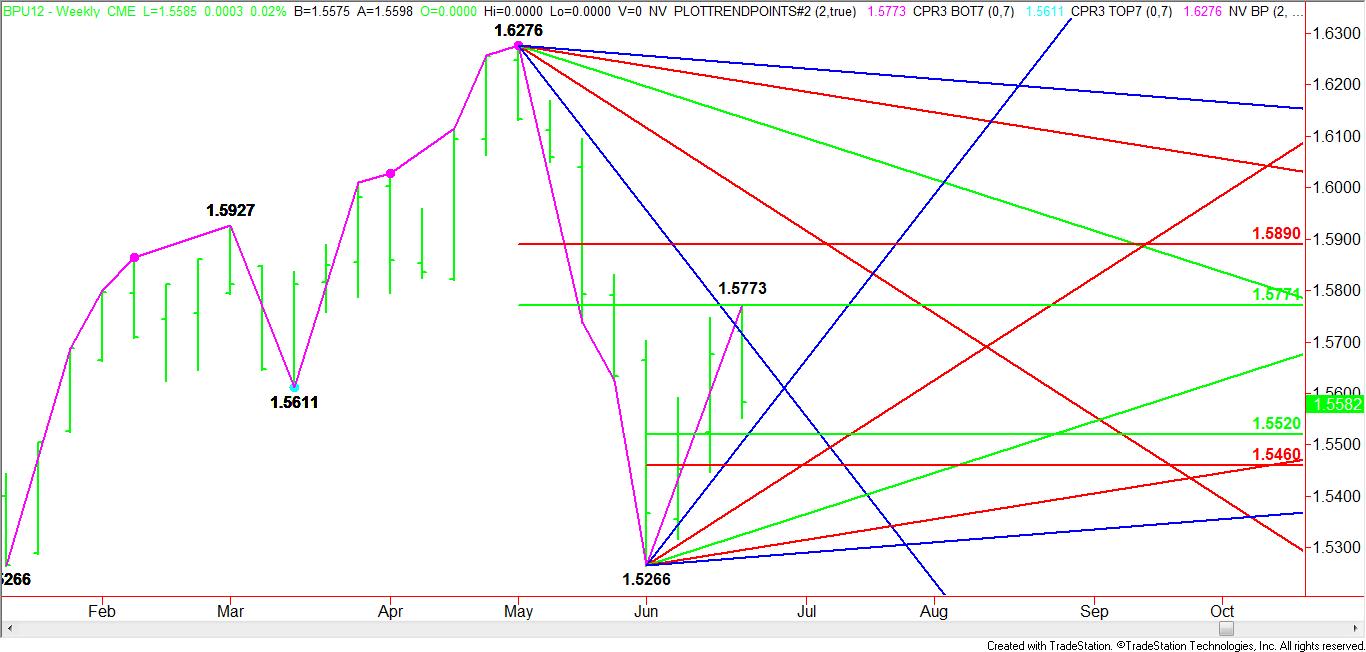
Last week the September British Pound ran into resistance at 50% of the break from 1.6276 to 1.5266. This price level is 1.5774 with the high reaching 1.5773. Additionally, the market also tested a steep downtrending Gann angle from the 1.6276 top. This set-up formed a small resistance cluster that traders respected. The subsequent sell-off triggered a break, but in my opinion did not form a true closing price reversal top since the last rally didn’t fall into the 7 to 10 trading day range.
The higher-high, lower-close on the weekly chart does indicate weakness but it may only be in the form of a short-term follow-through to the downside. Based on the near-term range of 1.5266 to 1.5773, this week traders should look for an early test of the uptrending Gann angle at 1.5586, followed by a possible trade into the retracement zone at 1.5520 to 1.5460.

With the main trend down on the daily chart because the recent break took out the swing bottom at 1.5611, the move to the 50% price level was expected. The key at this time is determining whether there is enough momentum to trigger an even further break. Based on the .1010 four-day break from 1.6276, we could be looking at a move to 1.4763 by June 28 if the British Pound follows the same swing cycle.
Although it sounds like I’m predicting a sharp break over the next 4-days, I am a little leery about the market reaching this price and time target because of the possibility of a secondary higher bottom. The short-term range of 1.5266 to 1.5773 is saying this market may only break back to the 50% to 61.8 percent level at 1.5520 to 1.5460.
With the Gann angles and the retracement level so close to each other, trading conditions could be choppy. Watch for a two-sided trade early in the week until traders can determine the direction they want to take.
The higher-high, lower-close on the weekly chart does indicate weakness but it may only be in the form of a short-term follow-through to the downside. Based on the near-term range of 1.5266 to 1.5773, this week traders should look for an early test of the uptrending Gann angle at 1.5586, followed by a possible trade into the retracement zone at 1.5520 to 1.5460.

With the main trend down on the daily chart because the recent break took out the swing bottom at 1.5611, the move to the 50% price level was expected. The key at this time is determining whether there is enough momentum to trigger an even further break. Based on the .1010 four-day break from 1.6276, we could be looking at a move to 1.4763 by June 28 if the British Pound follows the same swing cycle.
Although it sounds like I’m predicting a sharp break over the next 4-days, I am a little leery about the market reaching this price and time target because of the possibility of a secondary higher bottom. The short-term range of 1.5266 to 1.5773 is saying this market may only break back to the 50% to 61.8 percent level at 1.5520 to 1.5460.
With the Gann angles and the retracement level so close to each other, trading conditions could be choppy. Watch for a two-sided trade early in the week until traders can determine the direction they want to take.
