
Equities

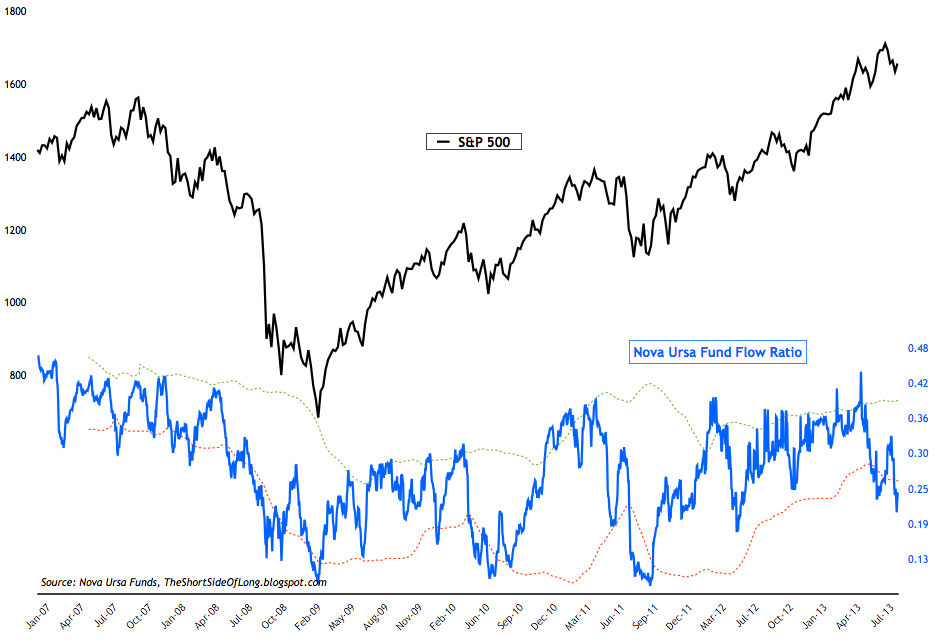


Chart 7: Commodity fund managers have started to increase exposure


Chart 10: A prices rebound from support, managers have added to greenback


- AAII survey readings came in at 36% bulls and 31% bears. Bullish readings rose by 2% while bearish readings rose by 1%. The AAII bull ratio (4 week average) currently stands at 5%, which stands right in the middle of the historical range for this indicator. Recent AAII Asset Allocation Survey showed a slight decrease in stock exposure and a slight increase in cash exposure towards 20% (still historically low). For reference, the AAII bull ratio survey chart can been seen here, while the AAII Cash Allocation survey chart can be seen here.
- Investor Intelligence survey levels came in at 37% bulls and 24% bears. Bullish readings decreased by 1%, while bearish readings remained unchanged. In recent weeks II bull ratio has pulled towards neutral territory for this indicator, but the sentiment is not yet anywhere close to pessimistic levels to justify a contrarian buy signal (chart above).
- NAAIM survey levels came in at 42% net long exposure, while the intensity fell to 0%. Fund managers remain at neutral levels of exposure towards but just like with II survey, the sentiment is not yet anywhere close to pessimistic levels to justify a contrarian buy signal. For referencing, recent NAAIM survey chart can been seen here.
- Other sentiment surveys have all pulled back towards neutral territory. Both the Consensus Inc survey and the Market Vane survey are giving us readings of 52% bulls and 58% bulls respectively. Extreme optimistic readings were seen several weeks ago at 75% and 70% for both indicators respectively, while buy signals usually occur at much much lower readings.
- Last weeks ICI fund flows report showed "equity funds had estimated inflows of $300 million for the week, compared to estimated inflows of $1.34 billion in the previous week. Domestic equity funds had estimated outflows of $1.00 billion, while estimated inflows to world equity funds were $1.30 billion." Not much is changed here, as retail money continues to leave bond funds and enter equity funds. Rydex fund flows have now fallen to new lows for the correction cycle. Recent data showed flow of funds indicator fell as low as 0.22 ratio, however major buying opportunities tend to occur when readings fall towards a ratio of 0.10 (March 2009, July 2010 and October 2011).
- Last weeks commitment of traders report showed that hedge funds and other speculators slightly increased their bullish bets. From the recent net long position of 82,000 contracts, positions edged up towards 83,500 net long contracts. Exposure remains elevated but not at extreme levels, which is usually associated with market corrections (chart above). Speaking of Nasdaq 100, it is worth noting that the index broke out to new 52 week highs and new bull market highs yesterday.
- Recent option data shows that equity only put call ratio shows that investors have purchased 45 puts for every 100 calls (or more than 2 calls for every 1 put). This is one of the highest readings in almost a year and indicates that retail investors (dumb money) expect higher prices ahead. That is usually a good contrary indicator.
- Bond sentiment surveys fallen to very pessimistic levels. Both the Market Vane survey and the Consensus Inc survey are at the most extreme levels they have been since February 2011 (last major low for Treasuries). This indicates that, from a contrary point of view, as soon as the selling exhausts itself... a tradable bottom and a good opportunity is at hand. For referencing, recent Consensus Inc survey chart can be seen here.
- Last weeks ICI fund flows report showed "bond funds had estimated outflows of $9.16 billion, compared to estimated outflows of $11.14 billion during the previous week. Taxable bond funds saw estimated outflows of $6.26 billion, while municipal bond funds had estimated outflows of $2.91 billion." Capital continues to leave just about all bond funds. Retail investors are literarily running for the exist doors as fast as possible. Bloomberg has recently reported that some of the worlds biggest funds are experiencing serious redemptions (click here for news article).
- Last weeks commitment of traders report shows that small speculators decreased net short bets on the Treasury Long Bond from recent extremes. Current readings now stand close to -56,000 net short contracts relative to -70,000 net short contracts two weeks ago, which was one of the most negative positions in years.
Chart 7: Commodity fund managers have started to increase exposure
- Last weeks commitment of traders report showed that hedge funds and other speculators continue to increase commodity exposure, but the overall positioning is still relatively low on historic basis (chart above). Cumulative net longs currently stand at 305,000 contracts (custom COT aggregate), which is only a slight increase from the the very low levels of 115,000 in late July / early August.
- Last week, exposure was increased in the agricultural sector, however grains exposure was increased mainly due to Soybeans while softs exposure was cut yet again. The chart above shows that futures exposure in the overall agricultural sector still remains extremely low on historical basis. Other sectors of the CRB Index showed a mixed picture, with energy exposure slightly cut and metals remaining unchanged.
- Commodity Public Opinion surveys remain mixed within the commodity complex. In general, there has been a slightly recovery in all commodity surveys since the prices rebounded from the lows seen this summer. The chart above shows that sentiment in the energy sector is now approaching very elevated levels while contract prices of WTI Crude, Brent Crude and Heating Oil approaching a major resistance from last couple of years.
Chart 10: A prices rebound from support, managers have added to greenback
- Last weeks commitment of traders report showed a substantial increase in net long exposure towards the US Dollar. Cumulative positioning by hedge funds and other speculators stands at $20 billion. Interestingly, despite a decently high net long position, invests are show the greenback against the Euro and Franc. Major short exposure still remains in the Aussie Dollar. Technically, the greenback respect the uptrend line and remains in a bull market for now.
- Currency Public Opinion survey readings on the US Dollar are at neutral levels. At the same time, Public Opinion on the foreign currencies is also around the middle of the historical range. As a side note, sentiment on the Pound is slightly elevated while sentiment on the Canadian Dollar is slightly depressed.
- Last weeks commitment of traders report showed hedge funds and other speculators continue to increase exposure in the Precious Metals sector. Exposure currently stands at 78,100 net long contracts on Gold and 18,800 net long contracts on Silver. The chart above shows that Gold (as well as Silver) have rallied strongly in recent weeks as short contracts have been closed out. According to the COT report, gross long positions have no increased at all since the lows in July, indicating that buyers are not coming into the market. In other words, at this stage this is only a short squeeze.
- Public opinion on alternative currencies like Gold and Silver has finally bounced from the depressed levels witnessed for weeks on end. Both Gold and Silver Public Opinion levels have reached neutral levels on historical basis. For referencing, recent Silver Public Opinion survey chart here.