Equities
Bonds
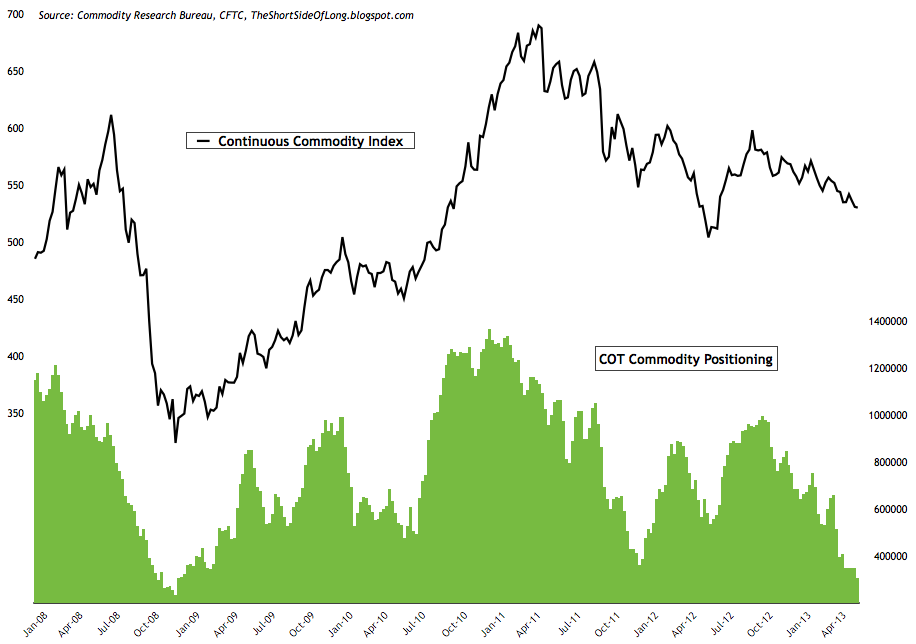
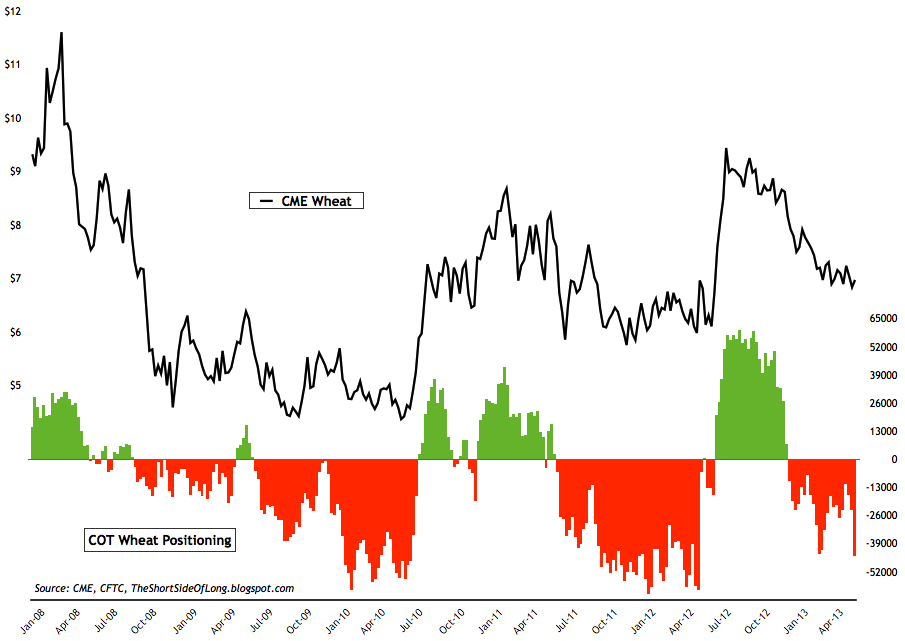
Chart 6: Hedge funds increase their bets on the US Dollar
Options positioning
- Another week ends, so it is time for sentiment update. AAII survey readings released mid week came in at 49% bulls and 22% bears. Bullish readings jumped by over 10% while bearish readings fell by 8%. Sentiment indicators job is to portray the mood and confidence of investment community. This indicator is currently not doing the best job as it continues to show considerable volatility in all directions (unlike many others posted on this blog). Last weeks long term AAII sentiment chart can be seen by clicking here.
- Investor Intelligence survey levels came in at 55% bulls and 19% bears. This weeks raw bullish reading was the highest in over two years. Furthermore, bull ratio remains on a "sell signal" and has approached a hefty 75% reading, which is the highest level since the major market top in 2011. Recent chart of the II bull ratio chart can be seen by clicking clicking here.
- NAAIM survey levels came in at 82% net long exposure, while the intensity came in at 41%. For months now, net long exposure has remained near some of the highest levels since the surveys inception. However, contrarians and bearish investors have not benefited from the "sell signal" just yet, as stocks remain in their parabolic run up. Recent NAAIM sentiment chart can be seen by clicking here.

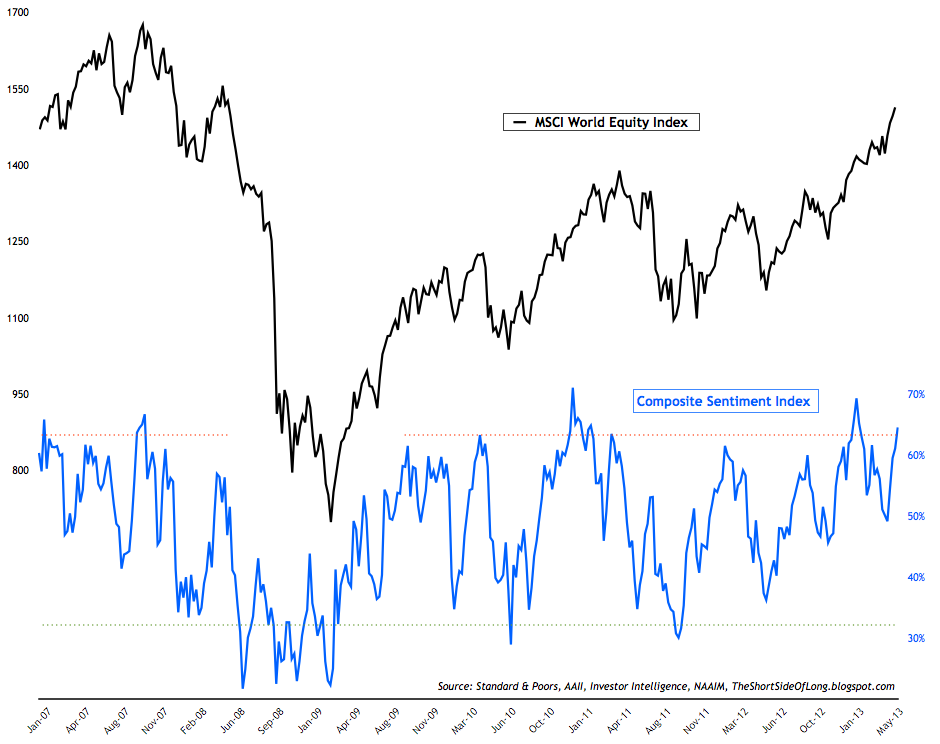
- If we group the three sentiment survey together into one indicator, we can see that bullish sentiment is once again approaching frothy levels seen for only the third time in the investment cycle (since the March 2009 bottom).
- Other sentiment surveys also continue to signal extremely overbought market conditions. Consensus Inc survey & Market Vane survey remain at or near extremely elevated level associated with previous market tops. Hulbert Newsletter Stock Sentiment surveys remain extremely frothy and basically unchanged from extremes seen last week. Recent Hulbert Nasdaq Sentiment survey chart can be seen by clicking here.
- This weeks ICI fund flows report showed "equity funds had estimated inflows of $2.38 billion for the week, compared to estimated inflows of $3.42 billion in the previous week." Recent ICI global equity fund flow chart can be seen by clicking here. Rydex fund flows have jumped to extreme levels surpassing previous euphoric readings for the investment cycle. Leveraged bullish positions have spiked dramatically and cash levels have pretty much collapsed over the last week. Recent chart of Rydex Nova Ursa funds can be seen by clicking here.
- Latest equity commitment of traders report showed that hedge funds and other speculators continue to hold an extremely high net long position on technology stocks. This weeks contract position came in at almost 129 thousand net longs. In recent weeks, bullish bets have been persistently extreme. If markets gets a catalyst, we could see a serious hedge fund shake out of bullish bets. Bernanke's speech this week was a catalyst for a technical reversal, but it remains to be seen how it will all play out. Recent chart of Nasdaq COT chart can be seen by clicking here.

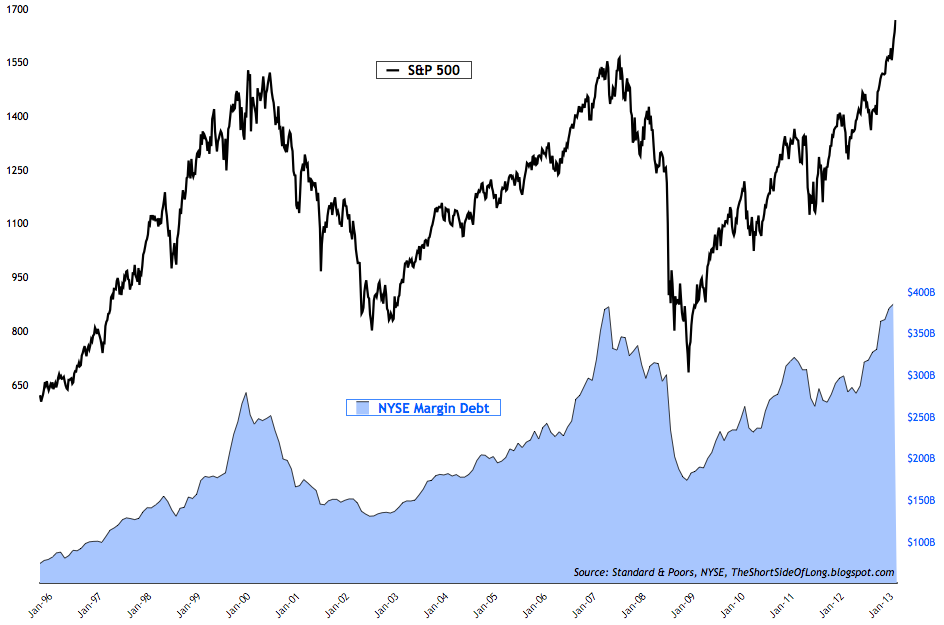
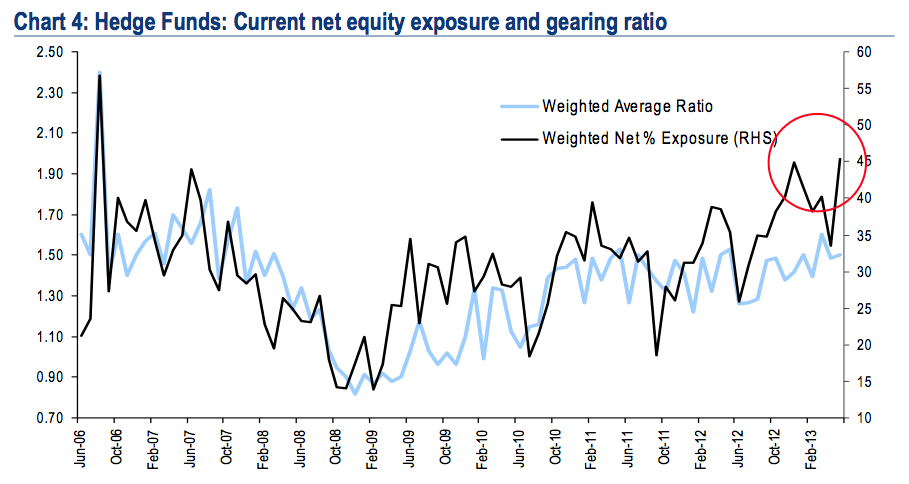
- The latest NYSE Margin Debt figures are out, showing that speculators continued to increase their leverage towards record highs. NYSE margin debt figures came in at about $385 billion, which is almost a 30% annualised increase. Unsurprisingly, majority of investors chase rallies and sell panics, never really investing based on the contrarian method of buying low and selling high. This can work as long as the trend remains in place, but the pain occurs at major turns. The fact is that majority of investors always buy near peaks and sell near troughs. This is also true for the industry "gurus", who like to think highly of themselves. Recent Merrill Lynch Fund Managers Survey reported that hedge funds currently hold one of the highest ever equity exposures with elevated levels of gearing (chart below).

Bonds
- Bond sentiment surveys remains largely unchanged from previous weeks readings. Both the Consensus Inc Survey & Market Vane Survey still remain dead smack in the middle of the bull vs bear percentage readings. Hulbert Newsletter Bond survey has also joined the neutral party too. Previous weeks Hulbert Bond Sentiment survey chart can be seen by clicking here.
- Recent commitment of traders report shows that small speculators remain net short the Treasury Long Bond by 23 thousand contracts. As already started, technical traders are looking at the recent failed rally in the government bond market as a first lower high in two and half years. Will the downtrend gather pace and interest rates rise? ML Fund Managers Survey shows that the overwhelming majority of investors do not expect inflation... and that is usually when we get it! Recent chart of Long Bond COT chart can be seen by clicking here.

- Latest commodity commitment of traders report showed that hedge funds and other speculators reduced net long bets towards 300,000 contracts. The current net long exposure is the lowest since the beginning of 2009, just as commodities bottomed out. Majority of agricultural commodities continue to be disliked by speculators, with Wheat net shorts rising to the highest level since mid 2012. In previous posts I have also shown how hedge funds remain underexposed towards industrial metals like Copper (click here) and energy commodities like Heating Oil (click here). Heating Oil bearish bets reached yet another record high this week.

- As already mentioned before, commodity Public Opinion surveys have rebounded from bearish extremes in recent weeks. However, a lot of individual commodities are still very much disliked. These include Live Cattle, Coffee, Lumber, Wheat and especially Sugar. Public Opinion on Sugar has reached one of the lowest levels in history!
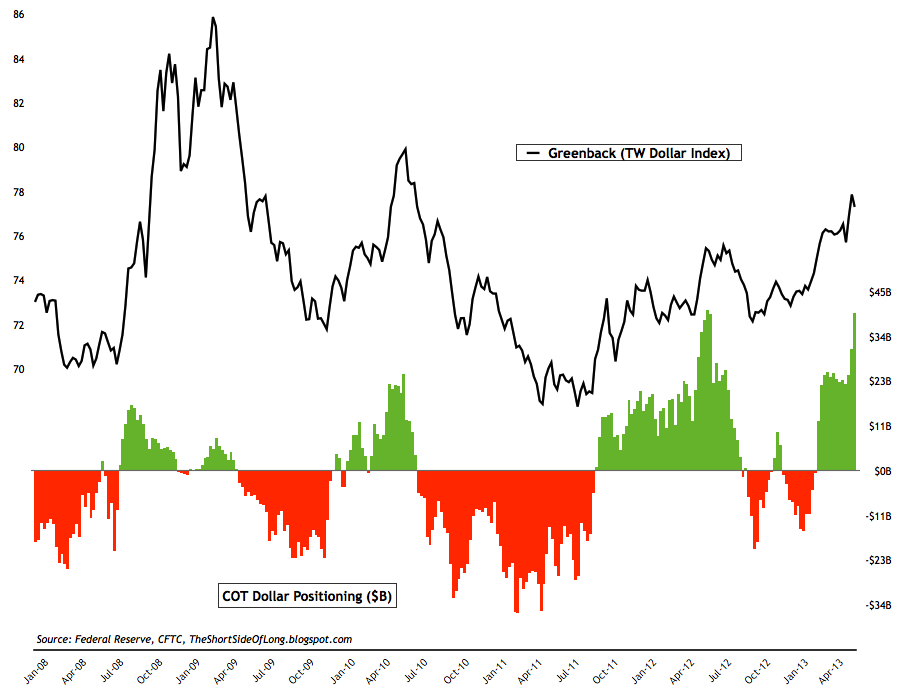
Chart 6: Hedge funds increase their bets on the US Dollar

- Latest currency commitment of traders exposure towards the US Dollar continues to increased just shy of record levels. Cumulative Dollar positioning stands close to $40 billion for only the second week in history. The other week was during the infamous June 2012 Draghi speech, which bottomed out the Euro and reversed the rise in PIIGS yields.

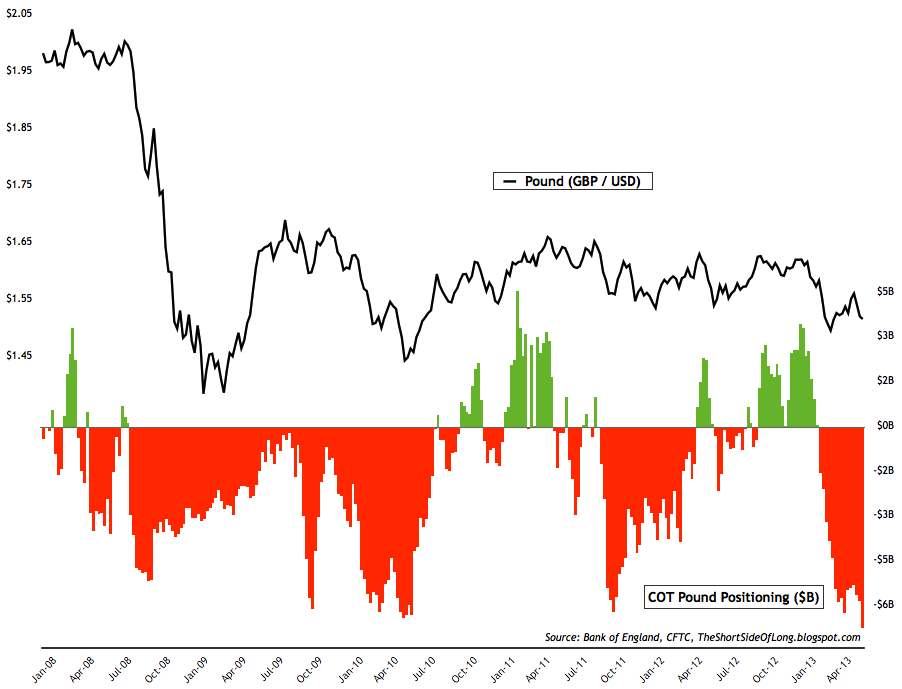
- Largest bullish bets on the Dollar are against currencies such as Japanese Yen, British Pound (at record highs), European Euro and Australian Dollar. Traders are now short every single major G-10 currency in the Trade Weighted Dollar Index, apart from the Kiwi Dollar.
- Currency Public Opinion survey readings on the US Dollar are still at near some of the highest levels of optimism. Swiss Franc, in particular, has joined Japanese Yen as one of the more hated and disliked currencies around the world.

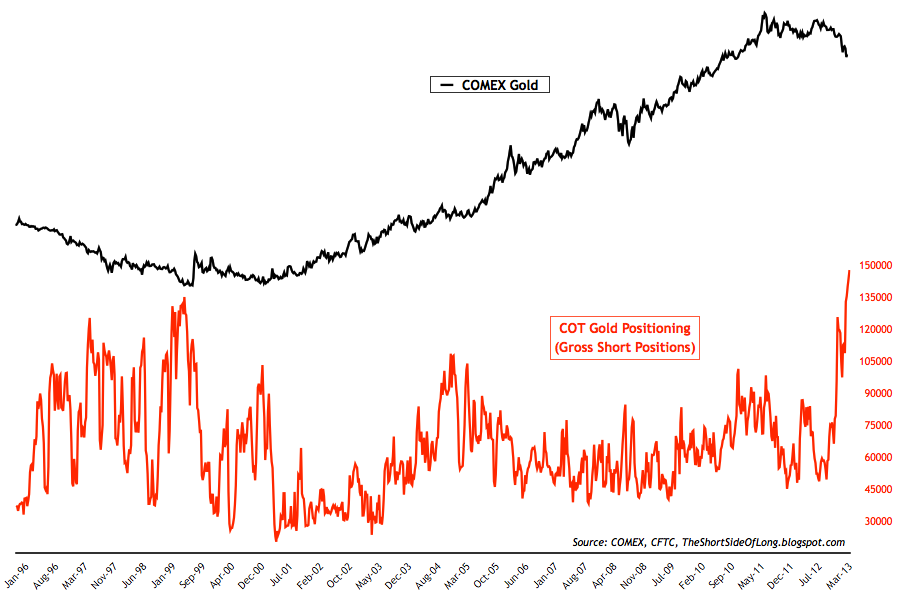
- Alternative currency commitment of traders report showed hedge funds and other speculators still keep on cutting their net long exposure. In Gold, hedge fund positions have now fallen towards 80 thousand, while in Silver positioning has dropped below the rare 10,000 contract level. Previous weeks charts for both precious metal COT readings can be seen by clicking here and here respectively. Furthermore, the chart above shows that Gold's gross short bets have reached an all time high. PMs bearish sentiment is making history!
- Public opinion on alternative currencies like Gold and Silver remains depressed as well. In particular, Gold's Public Opinion has fallen to the lowest level since middle of 2001, almost twelve years ago (by the way - twelve years ago I was a kid!)

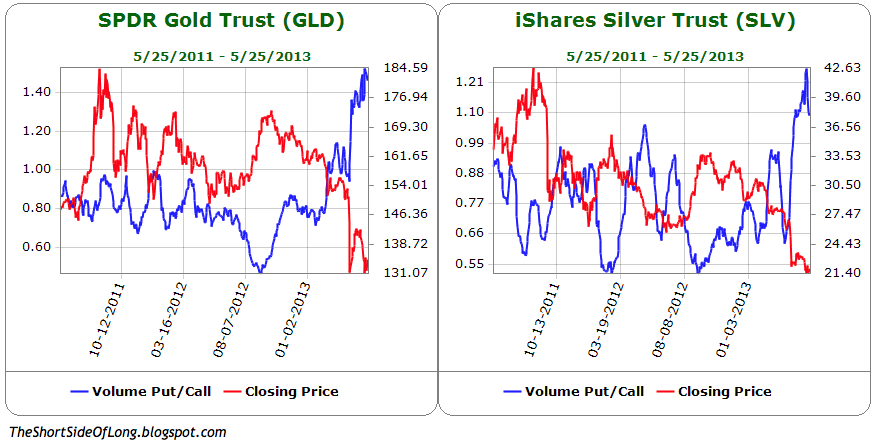
Options positioning
on Precious Metals confirms the bearish tone seen in COT positioning and Public Opinion readings. Investors hold some of the highest Put vs Call levels on both the GLD and SLV. The chart above shows that Put / Call ratios have exceed 1 in both ETFs, and in GLD have reached a level where investors have purchased over 1.5 Puts for every 1 Call.
