
Equities
Chart 1: Retail investors are once again turning bullish on stocks
- AAII survey readings came in at 46% bulls and 25% bears. Bullish readings rose by a huge 10% while bearish readings fell by 7%. The AAII bull ratio has once again risen near the bullish extremes (chart above), but is not yet giving us a warning signal. For referencing, AAII bull ratio survey chart can been seen by clicking here, while AAII Cash Allocation survey chart can be seen by clicking clicking here.
Chart 2: For years, newsletter advisors have not been bearish on stocks
- Investor Intelligence survey levels came in at 37% bulls and 23% bears. Bullish readings were unchanged, while bearish readings dropped by 1%. In recent weeks, the media has focused on "bearish sentiment" as a reason to the recent rally in stocks. The truth is, newsletter advisors have not been bearish on equities for years (chart above), but essentially just remain either bullish or neutral. For referencing, II bull ratio survey chart can been seen by clicking here.
- NAAIM survey levels came in at 67% net long exposure, while the intensity fell to 125%. Fund managers still remain at neutral levels of exposure towards stocks. Furthermore, just like the S&P 500 price itself, sentiment has been swinging in both directions according to this indicator. For referencing, recent NAAIM survey chart can been seen by clicking here.
- Other sentiment surveys have all pulled back towards neutral territory. Both the Consensus Inc survey and the Market Vane survey are giving us readings of 50% bulls and 62% bulls respectively. While the first has fallen back towards neutral levels, the other remains near bullish extremes.
Chart 3: Capital is leaving bond funds, as equity inflows continue
- Last weeks ICI fund flows report showed "equity funds had estimated inflows of $904 million for the week, compared to estimated outflows of $212 million in the previous week. Domestic equity funds had estimated outflows of $694 million, while estimated inflows to world equity funds were $1.60 billion." Capital is leaving bond funds, as equity inflows continue. Rydex fund flows have fallen during the recent correction. Recent data showed flow of funds indicator remains just below 0.30, which is a neutral reading. Major buying opportunities tend to occur when readings fall towards a ratio of 0.10 (March 2009, July 2010 and October 2011). For referencing, recent Rydex fund flow chart can been seen by clicking here.
- Last weeks commitment of traders report showed that hedge funds and other speculators slightly increased their bullish bets yet again. Recent net long positions now stand at 91,850 contracts. Just like stated last week, exposure remains elevated but not at extreme levels, which is usually associated with market corrections. For referencing, recent Rydex fund flow chart can been seen by clicking here.
Bonds
- Bond sentiment surveys fallen to very pessimistic levels, similar to last week. Both the Market Vane survey and the Consensus Inc survey are at the most extreme levels they have been since February 2011 and giving a buy signal. From a contrary point of view, as soon as the selling exhausts itself, a tradable bottom is at hand for shorter term traders. For referencing, recent Consensus Inc survey chart can be seen by clicking clicking here.
Chart 4: Capital continues to leave bond funds at rapid pace
- Last weeks ICI fund flows report showed "bond funds had estimated outflows of $6.77 billion, compared to estimated outflows of $9.30 billion during the previous week. Taxable bond funds saw estimated outflows of $4.72 billion, while municipal bond funds had estimated outflows of $2.05 billion." This is now the forth monthly outflow of capital in the row for all major taxable bond funds. At the same time, corporate bond ETF (NYSE: LQD) has now made a new lower low.
Chart 5: Super bearish Treasury bond exposure remains in place
- Last weeks commitment of traders report shows that small speculators decreased net short bets on the Treasury Long Bond from recent extremes. Current readings now stand close to -55,400 net short contracts relative to -70,000 net short contracts only a few weeks ago, which was one of the most negative positions in years.
Chart 6: What happens to stocks when interest rates rise?
- I was recently asked what could happen to the stock market, if interest rates continue to rise? Well, the chart above shows how, over the last decade and half, rise in long term interest rates has affected the stock market in the form of a pull back or major top. Please do not understand me, this is not a guarantee, as there have been periods throughout 1950s and 60s (as well as other periods) were rates rose together with stocks up to a certain level.
Commodities
Chart 7: Commodity prices and exposure still remain in a downtrend
- Last weeks commitment of traders report showed that hedge funds and other speculators continue to decreased their commodity exposure. Cumulative net longs currently stand at 280,000 contracts (custom COT aggregate), which is only a slight increase from the the very low levels of 115,000 in late July / early August. Price wise, the overall sector still remains in a downtrend as seen in the chart above. Finally, last weeks exposure was decreased in almost all commodity sectors apart from softs.
- Commodity Public Opinion surveys remain mixed within the commodity complex. In general, there has been a slightly recovery in all commodity surveys since the prices rebounded from the lows seen this summer. The chart above shows that sentiment in the energy sector is now approaching very elevated levels while contract prices of WTI Crude, Brent Crude and Heating Oil approaching a major resistance from last couple of years. For referencing, recent Energy Public Opinion survey can been seen by clicking here.
Currencies
Chart 8: US Dollar exposure was slightly increased last week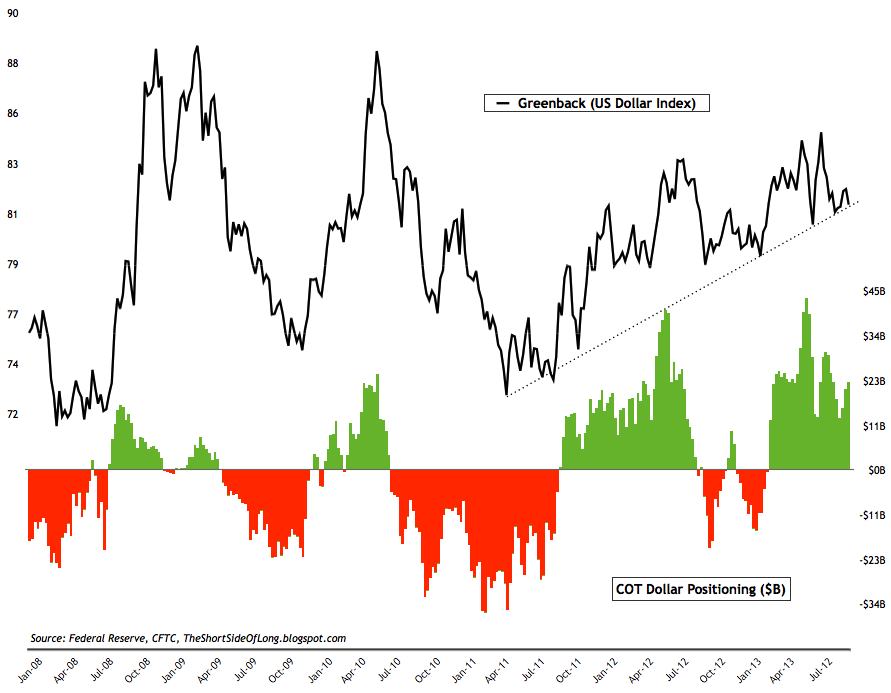
- Last weeks commitment of traders report showed a slight increase in net long exposure towards the US Dollar. Cumulative positioning by hedge funds and other speculators stands at $22 billion, an increase of about $2 billion from the previous week. Major net long positions are evident in the Euro, while major net shorts on the Aussie and the Yen. Technically, the greenback is still testing its uptrend line at this point.
- Currency Public Opinion survey readings on the US Dollar are at neutral levels. At the same time, Public Opinion on the foreign currencies is also around the middle of the historical range. As a side note, sentiment on the Pound is now very elevated and usually at levels where corrections tend to occur.
Chart 9: Silver traders have been adding positions for weeks
- Last weeks commitment of traders report showed hedge funds and other speculators decreased exposure in the Precious Metals sector. Positioning currently stands at 68,700 net long contracts on Gold and 15,800 net long contracts on Silver. The chart above shows that speculators have been adding exposure towards the metal for weeks, however according to the COT report, Silver Open Interest has fallen dramatically during the same time frame. This lets us know a lot of shorts have covered.
- Public opinion on alternative currencies like Gold and Silver is now around neutral levels from the depressed levels witnessed during the summer doldrums. For referencing, recent Silver Public Opinion survey chart can been seen by clicking here.
Chart 10: Further sell offs in Gold miners should be bought...
- Because I am a long term precious metals bull, I tend to receive quite a lot of emails regarding Gold Miners. While I cannot comment on every single characteristic about this sector in one paragraph, the chart above show the extreme oversold state. On any further weakness, longer term investors could start accumulating positions here, however I continue to prefer metals like Gold and especially Silver.