Continuing on with our general market overview: if there’s one thing that has boosted the market more than anything else lately, it has been the recovery in the energy sector. As you’ll recall, 2015 was a disastrous year for energy, and the breakdown really accelerated in the first few weeks of 2016. It looked like countless energy firms were going to go bankrupt, the high yield bonds were falling apart, and oil itself was worth less than the barrels used to contain the stuff.
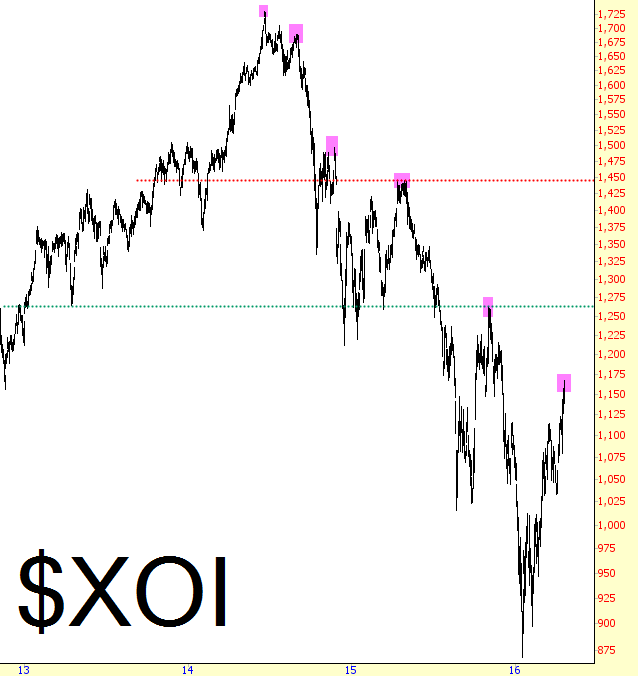
What’s crucial to remain mindful of is how all this time, the oil sector has been doing nothing but making a series of lower highs. Take a good look at the tinted prices below. There have been many “recoveries” along the way, the most recent of which has been the most violent. Until and unless it pushes past that green line at about 1270, however, the tremendous surge since January 20th is just that: another countertrend rally in the face of a long-term downturn.

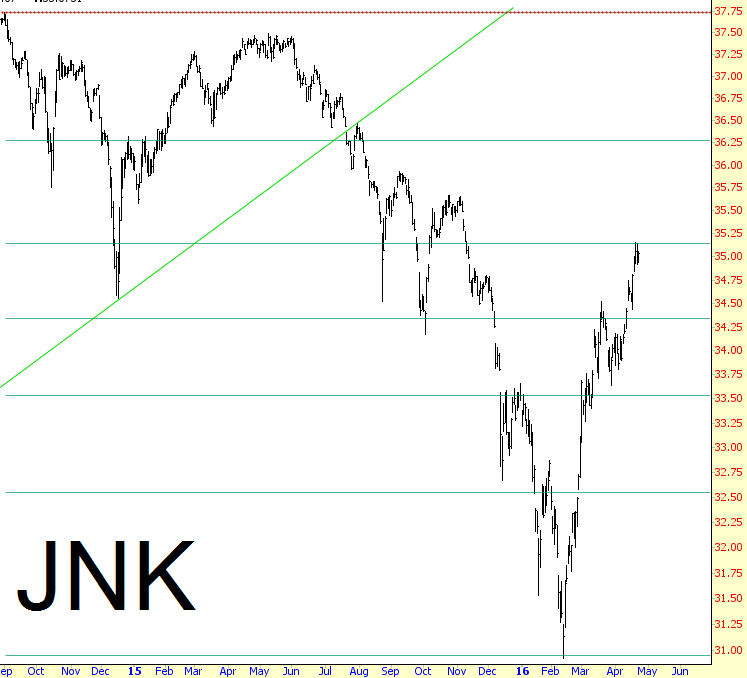
If that is, in fact, the case, high yield bonds are going to remain as vulnerable as they were before. Examine the chart of SPDR Barclays (LON:BARC) High Yield Bond (NYSE:JNK) below, which I’ve augmented with Fibonacci retracement levels. Pay special attention to where present price levels are vis a vis the retracements.

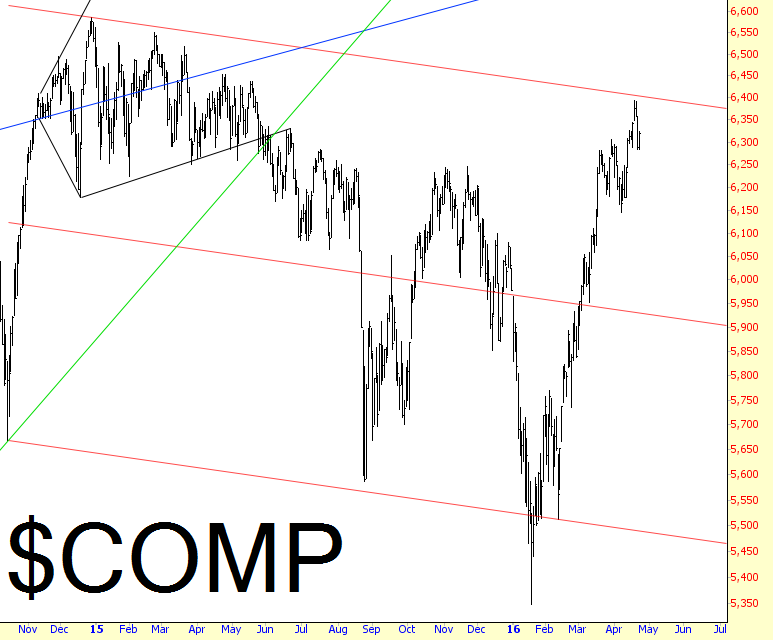
This all ties into the stock market in general. The Dow Jones Composite isn’t the squeaky-clean pattern that it used to be, but it is still following a decently-defined downward channel, whose midline is also shown below. We are at the upper end of this range.

