
 EUR/USD" title="EUR/USD" width="1225" height="610">
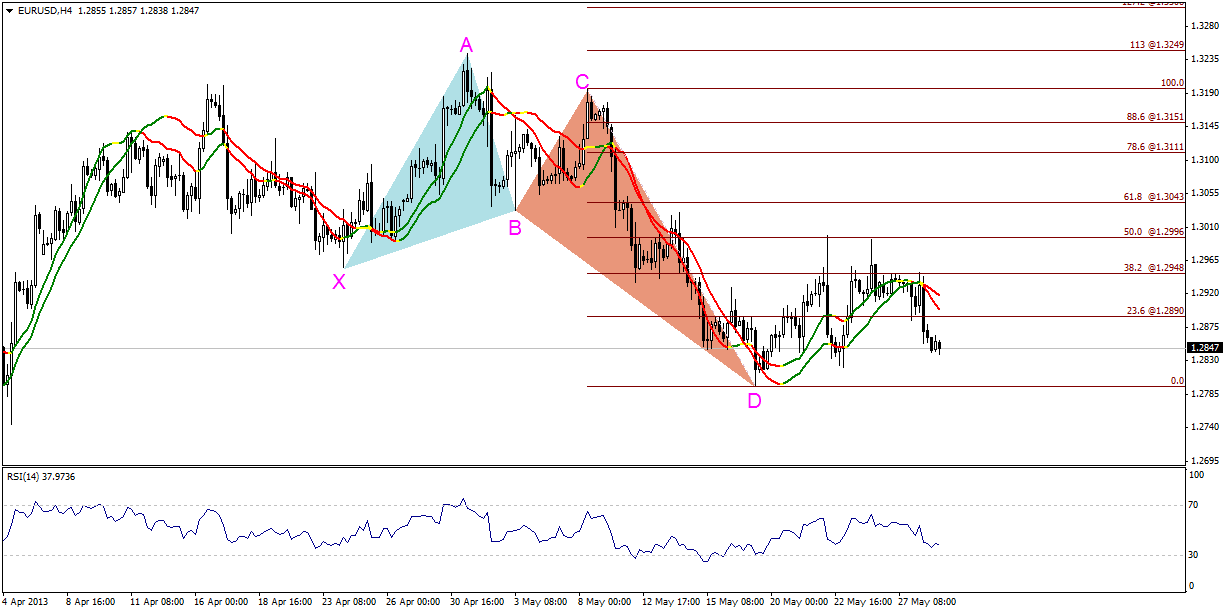
The pair dropped sharply yesterday and failed to stabilize above 1.2870 forcing it to settle below 23.6% Fibonacci of CD Leg of the bullish harmonic Butterfly Pattern, settling at the first target of the pattern residing at 1.2950. Stability below 1.2890 is negative now, meanwhile we cannot confirm extending the downside move in light of stabilizing above point D of the pattern. Therefore, we prefer to remain intraday neutral today.
The trading range for today is among the key support at 1.2720 and key resistance at 1.2970.
The general trend over short-term basis is to the downside targeting 1.2560 as far as areas of 1.3270 remains intact. EUR/USD: Support And Resistance" title="EUR/USD_S&R" width="638" height="101">
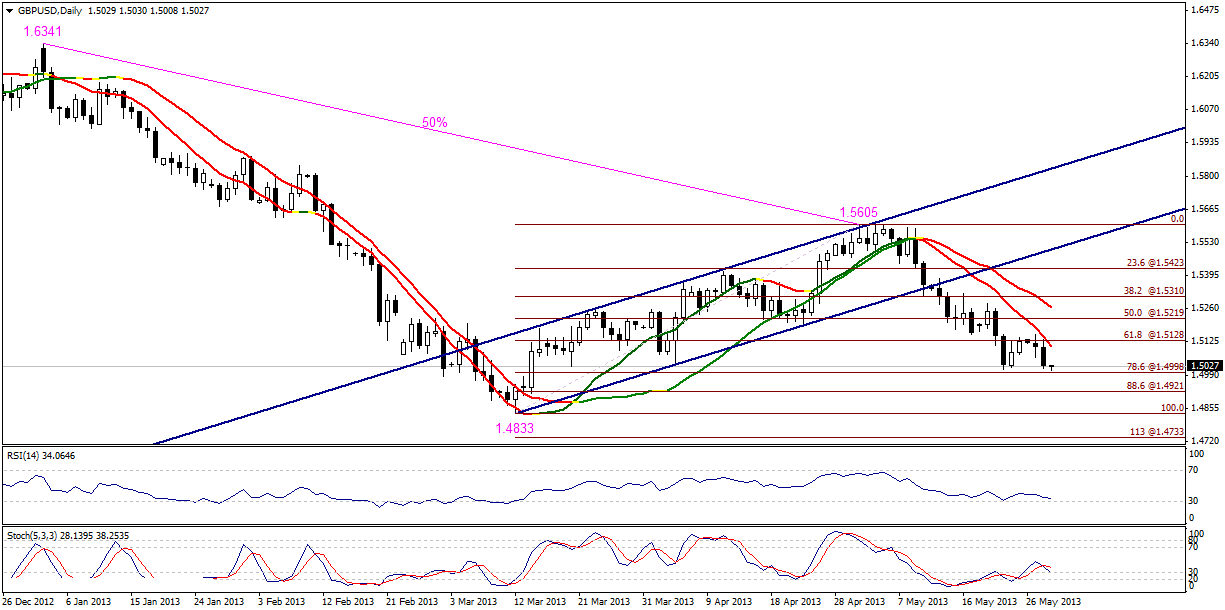 GBP/USD: Daily" title="EUR/USD_S&R" width="1225" height="610">
The pair dropped close to 78.6% correction at 1.4995 failing our positive expectations of yesterday, and Stochastic showed a negative divergence while Linear Regression Indicators are negative. But we need to confirm stability below 1.4995 to support the idea of extending the downside move, and without that we prefer to remain intraday neutral as failing to stabilize below the referred to level might trigger a new bullish rebound.
The trading range for today is among key support at 1.4825 and key resistance at 1.5130.
The general trend over short term basis is to the downside as far as areas of 1.5770 remains intact targeting 1.4355. GBP/USD: Support And Resistance" title="GBP/USD_S&R" width="633" height="115">
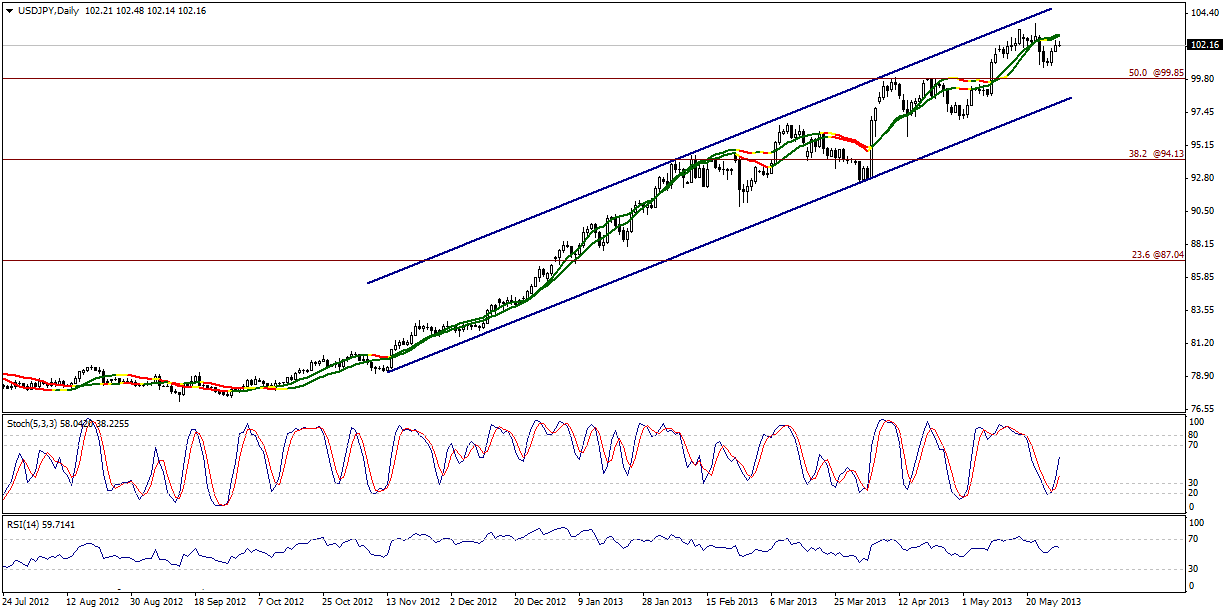 USD/JPY: Daily" title="USD/JPY" width="1225" height="610">
The pair’s move to the upside is still limited below Linear Regression Indicators and RSI tends to be negative. These catalysts are supported by stability below 102.50, therefore we hold on to our intraday negative expectations today.
The trading range for today is among key support at 100.85 and key resistance at 103.10.
The general trend over short term basis is to the upside as far as areas of 96.50 remain intact targeting 105.60.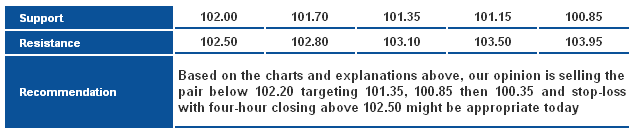 USD/JPY: Support And Resistance" title="USD/JPY_S&R" width="640" height="134">
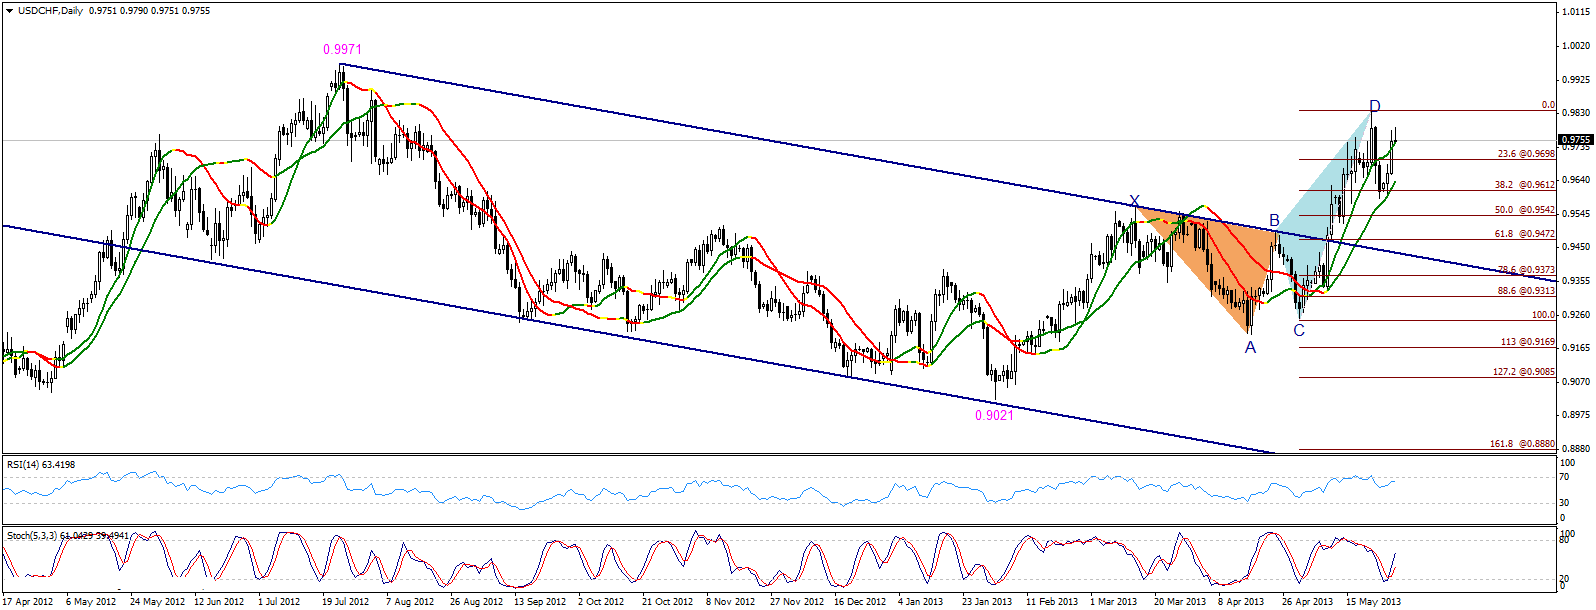 USD/CHF: Daily" title="USD/CHF" width="1596" height="610">
The pair moved sharply to the upside failing our negative expectations of yesterday while it failed to stabilize above 0.9775, whereas it is required to support extending the bullish move. Failing to stabilize above 0.9775 doesn’t end the effect of the bearish harmonic Butterfly Pattern meanwhile the downside move requires trading stably again below 0.9700. Therefore, we prefer to remain intraday neutral today.
The trading range for today is among key support at 0.9610 and key resistance at 0.9835.
The general trend over short term basis is to the downside stable at levels 0.9775 targeting 0.8860.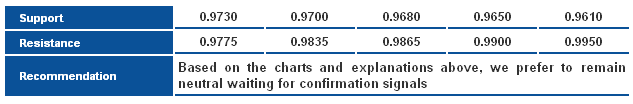 USD/CHF: Support And Resistance" title="USD/CHF_S&R" width="633" height="104">
 USD/CAD: H4" title="USD/CAD" width="1098" height="718">
The pair moved to the upside yesterday as expected and proved the bullish bias by previously stabilizing above 1.0270. Today we find the pair close to resistance level 1.0430, but trading above 1.0380 triggers the extension of the upside move. Therefore, we suggest an upside move for today.
The trading range for today is between the key support at 1.0300 and the key resistance at 1.0540.
The general trend over short term basis is to the upside with steady daily closing above levels 0.9800 targeting 1.0485.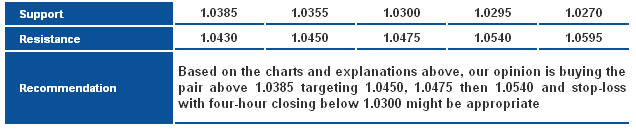 USD/CAD: Support And Resistance" title="USD/CAD_S&R" width="636" height="129">
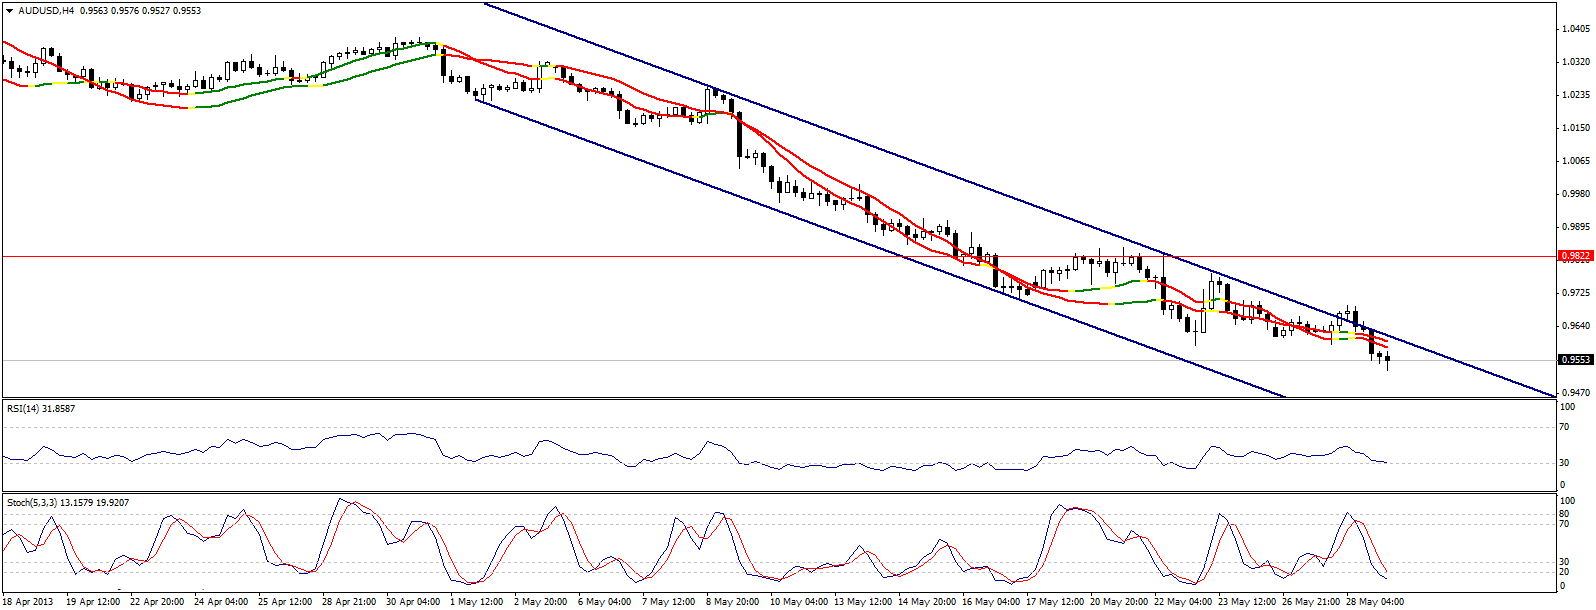 AUD/USD: H4" title="AUD/USD" width="1596" height="610">
The AUD/USD returned trading below the bearish channel's resistance – a negative event that could push the pair lower. Trading below 0.9690 is negative and steadying below 0.9620 empowers negativity.
**Trading range expected today is between the key support at 0.9365 and the key resistance 0.9725.
**Short-term trend is donwside targeting 0.9400 if 1.0710 remains intact.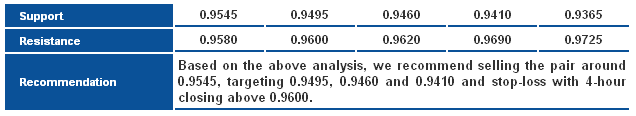 AUD/USD: Support And Resistance" title="AUD/USD_S&R" width="636" height="116">
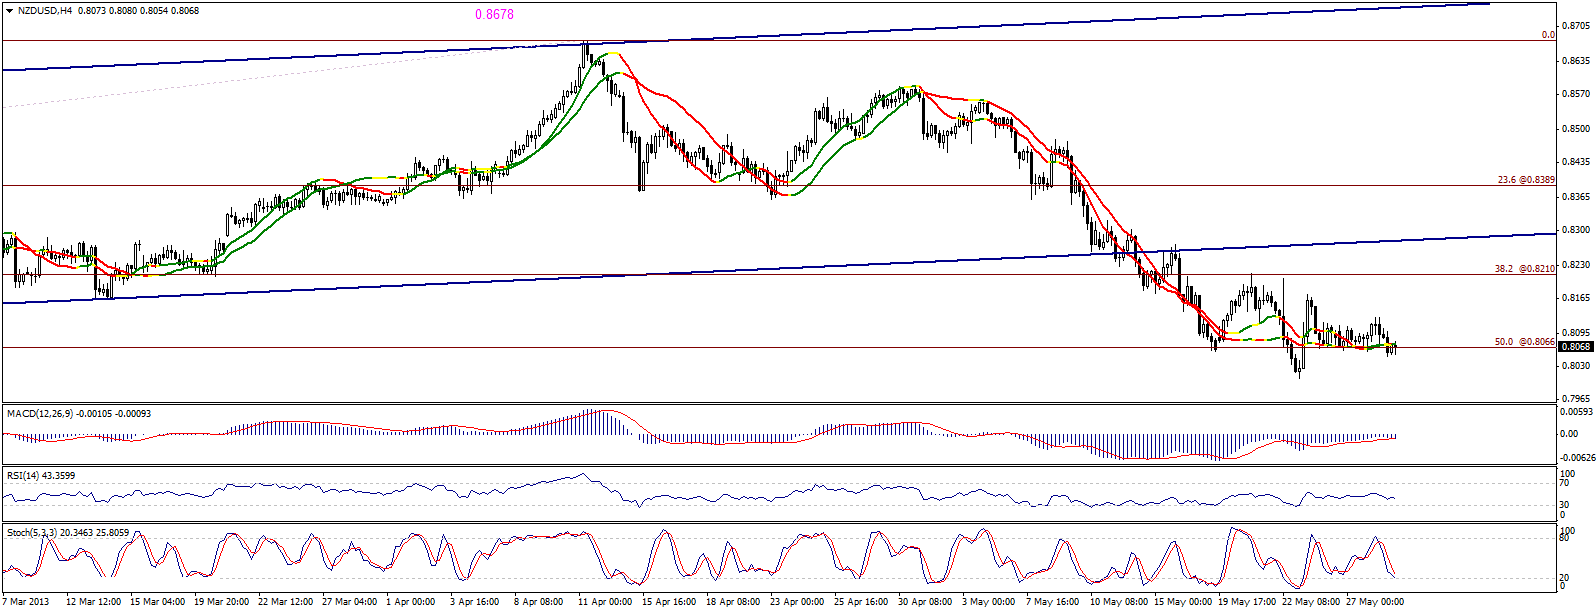 NZD/USD: H4" title="NZD/USD" width="1596" height="610">
The NZD/USD dropped but only to areas around 0.8065, which represents an intraday interval essential for the pair's movement. The relative strength index is bearishly biased, trading below the 50-point line. But, at the same time, the Stochastic is reflecting oversold signals. Therefore, we recommend neutrality on intraday basis as we wait for signs of a specific direction.
**Trading range expected today is between the key support at 0.7920 and the key resistance 0.8225.
**Short-term trend is downside targeting 0.7715 if 0.8400 remains intact.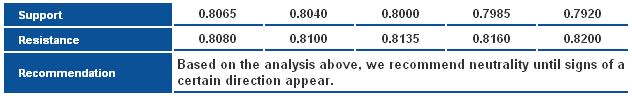 NZD/USD: Support And Resistance" title="NZD/USD_S&R" width="632" height="96">