WebMD Health Corp. (WebMD) is a provider of health information services to consumers, physicians and other healthcare professionals, employers and health plans through its public and private online portals, mobile platforms and health-focused publications.
Let's start with the news that has the stock, WBMD, losing more than a quarter of its value yesterday. Here's a snippet from The Motley Fool:
"Today was actually a double whammy. First, it was announced that WebMD CEO Wayne Gattinella had resigned and that he'd be replaced in the interim by the company's CFO. Secondly, and most importantly, after failing to find what the company deemed an adequate bidder, WebMD took down the "for sale" sign in its front yard. WebMD will remain an independent company, but warned that slower ad spending from drugmakers and increased competition could cause near-term shortfalls in sales and earnings."
Source: Fool.com via Yahoo! Finance WebMD Shares Imploded: What You Need to Know, written by Sean Williams.
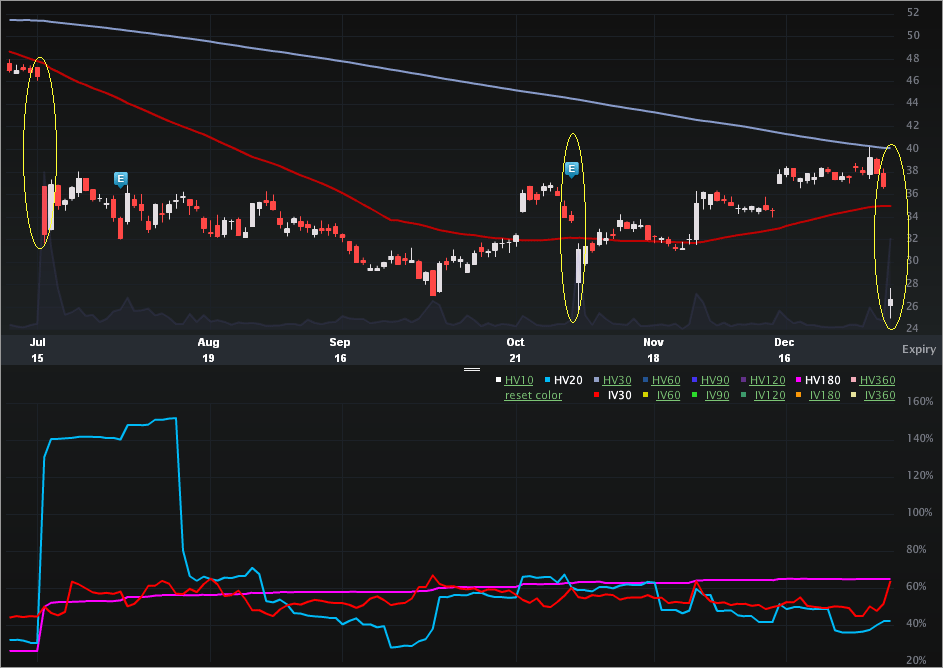
Yikes... Let's turn to the Charts Tab (6 months) below. The top portion is the stock price, the bottom is the vol (IV30™ - red vs HV20 - blue vs HV180 - pink).

What's troubling is not just the news(or double news), but also the tendency for the company to gap down with fairly high frequency. On 7-18-2011, the stock dropped 30% from $46.48 to $32.48. The news from that drop was simply a reduction in 2011 forecast for sales and profits -- again citing declining ad revenue. I sourced that from a Bloomberg article (via Yahoo! finance). You can read the full article here: WebMD Shares Post Biggest Drop Ever After Company Reduces 2011 Forecast, written by Lisa Rapaport and Zachary Tracer.
Then, on 11-3-2011, the stock dropped 7.7% from $33.75 to $31.15 on a planned earnings release. The news yesterday is again warning of falling ad revenue -- along with some other resulting news... Like no bidders (or no bids that the company will entertain).
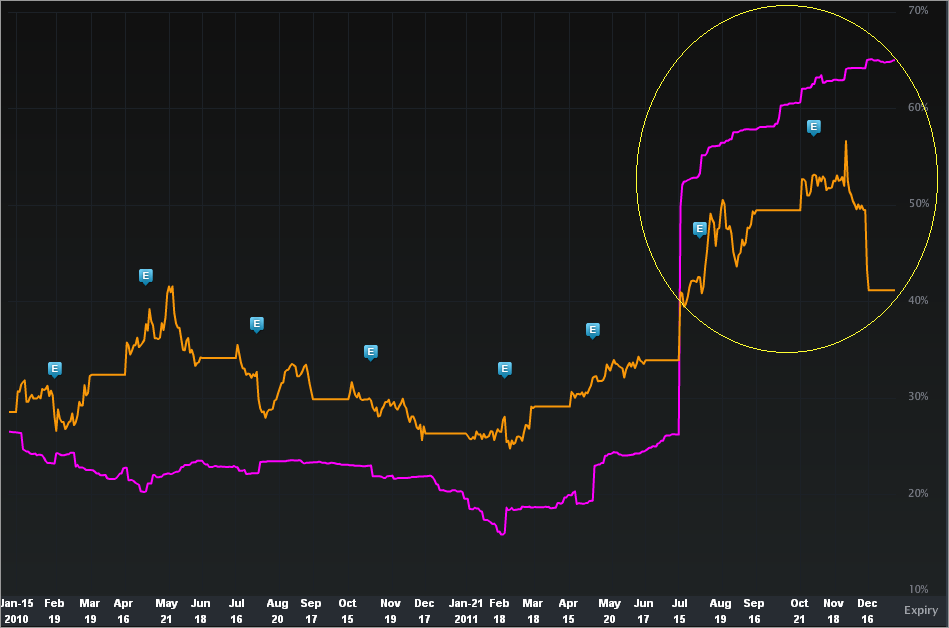
On the vol side, what's fascinating about this company is that the implied tends to trade below the long-term historical realized vol. In English, the short term options are priced with lower volatility than the long-term realized stock movement. When I examined the longer-term implied vol (IV180™), that same phenomenon exists. I've included a two year chart (just vols) of HV180 (pink) to the IV180 (orange), below.

Check out how the long-term implied used to trade above the long-term realized vol. That's the option market reflecting greater long term risk than the stock had realized in the past. But, after the cataclysm that was the pre-announcement, the reverse occurred. The option market reflected (and still reflects) lower implied future risk while the actual realized vol has been increasing. Pretty weird... But, it gets weirder...
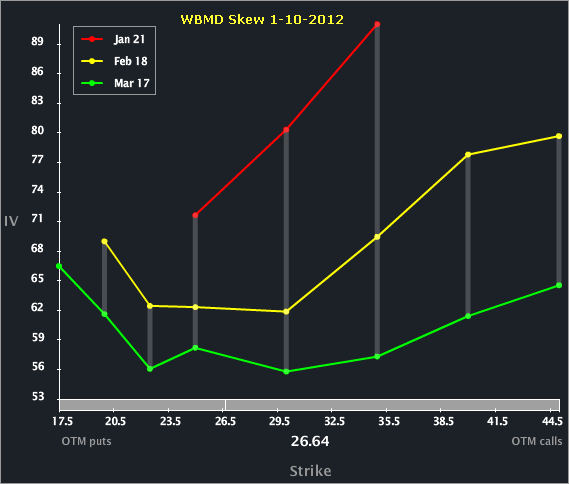
Let's turn to the Skew Tab.

We can see that the skew in WBMD reflects more upside risk than downside. When I looked back at the historical skew in LVP, that's kinda the deal with this stock. That is, even with the incredibly bad news and stock returns to the downside, the skew reflects more upside potential than downside risk. That's likely a reflection of the takeover / sales process... which has failed...
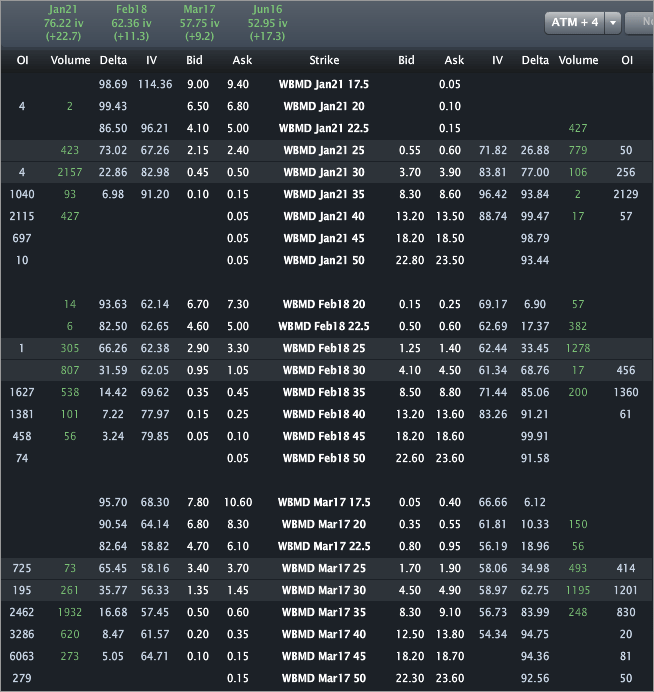
Finally, let's turn to the Options Tab for completeness.

We can see the monthly vols are priced to 76.22%, 62.36%, 57.75% and 52.95% for Jan, Feb, Mar and Jun. Again, the longer-term implied is depressed relative to the short-term vol. We can also see the volume in the Jan 30 calls (the green number) -- that looks like substantially purchases on almost nonexistent OI.
This is trade analysis, not a recommendation.
Let's start with the news that has the stock, WBMD, losing more than a quarter of its value yesterday. Here's a snippet from The Motley Fool:
"Today was actually a double whammy. First, it was announced that WebMD CEO Wayne Gattinella had resigned and that he'd be replaced in the interim by the company's CFO. Secondly, and most importantly, after failing to find what the company deemed an adequate bidder, WebMD took down the "for sale" sign in its front yard. WebMD will remain an independent company, but warned that slower ad spending from drugmakers and increased competition could cause near-term shortfalls in sales and earnings."
Source: Fool.com via Yahoo! Finance WebMD Shares Imploded: What You Need to Know, written by Sean Williams.
Yikes... Let's turn to the Charts Tab (6 months) below. The top portion is the stock price, the bottom is the vol (IV30™ - red vs HV20 - blue vs HV180 - pink).

What's troubling is not just the news(or double news), but also the tendency for the company to gap down with fairly high frequency. On 7-18-2011, the stock dropped 30% from $46.48 to $32.48. The news from that drop was simply a reduction in 2011 forecast for sales and profits -- again citing declining ad revenue. I sourced that from a Bloomberg article (via Yahoo! finance). You can read the full article here: WebMD Shares Post Biggest Drop Ever After Company Reduces 2011 Forecast, written by Lisa Rapaport and Zachary Tracer.
Then, on 11-3-2011, the stock dropped 7.7% from $33.75 to $31.15 on a planned earnings release. The news yesterday is again warning of falling ad revenue -- along with some other resulting news... Like no bidders (or no bids that the company will entertain).
On the vol side, what's fascinating about this company is that the implied tends to trade below the long-term historical realized vol. In English, the short term options are priced with lower volatility than the long-term realized stock movement. When I examined the longer-term implied vol (IV180™), that same phenomenon exists. I've included a two year chart (just vols) of HV180 (pink) to the IV180 (orange), below.

Check out how the long-term implied used to trade above the long-term realized vol. That's the option market reflecting greater long term risk than the stock had realized in the past. But, after the cataclysm that was the pre-announcement, the reverse occurred. The option market reflected (and still reflects) lower implied future risk while the actual realized vol has been increasing. Pretty weird... But, it gets weirder...
Let's turn to the Skew Tab.

We can see that the skew in WBMD reflects more upside risk than downside. When I looked back at the historical skew in LVP, that's kinda the deal with this stock. That is, even with the incredibly bad news and stock returns to the downside, the skew reflects more upside potential than downside risk. That's likely a reflection of the takeover / sales process... which has failed...
Finally, let's turn to the Options Tab for completeness.

We can see the monthly vols are priced to 76.22%, 62.36%, 57.75% and 52.95% for Jan, Feb, Mar and Jun. Again, the longer-term implied is depressed relative to the short-term vol. We can also see the volume in the Jan 30 calls (the green number) -- that looks like substantially purchases on almost nonexistent OI.
This is trade analysis, not a recommendation.
