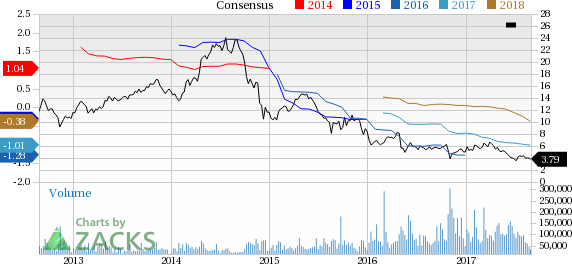
About a month has gone by since the last earnings report for Weatherford International PLC (NYSE:WFT) . Shares have lost about 9.1% in that time frame.
Will the recent negative trend continue leading up to the stock's next earnings release, or is it due for a breakout? Before we dive into how investors and analysts have reacted of late, let's take a quick look at the most recent earnings report in order to get a better handle on the important drivers.
Second-Quarter Results
Weatherford reported second-quarter 2017 adjusted loss of $0.28 per share, in line with the Zacks Consensus Estimate as well as the year-earlier number. The loss was mainly attributable to adverse impact of pressure pumping operations and lower product sales.
Second-quarter total revenue decreased to $1,363.0 million from $1,402.0 million in the year-ago quarter and also lagged the Zacks Consensus Estimate of $1,417.0 million.
Operational Performance
North American revenues for the second quarter were $475 million, up 18.5% from the year-ago comparable quarter. Increased drilling and completion activities resulted in higher revenues from all product lines in the U.S. Operating income during the quarter was $2 million. The company reported an operating loss of $101 million in the prior-year quarter.
Middle East/North Africa/Asia posted revenues of $340 million, down 15% or $60 million from the year-earlier period. Second-quarter operating income of $9 million decreased from $50 million in the prior-year quarter. The decline in revenues is attributable to lower product sales across the region and continued pricing pressure.
Europe/West Africa/FSU posted revenues of $244 million, down from $243 million from the year-earlier quarter. The decrease was mainly due to lower Secure Drilling product sales in Europe. Operating income in the reported quarter was $5 million compared to an operating income of $1 million in the prior-year quarter.
Latin American revenues of $203 million were down $46 million or 18.5% year over year. Second-quarter operating loss was $35 million compared with operating income of $1 million in the year-ago period. Revenues declined primarily due to a change in revenue accounting in Venezuela.
Liquidity
As of Jun 30, Weatherford had $584 million in cash and cash equivalents. Long-term debt amounted $7,538 million. The company spent approximately $42 million in capital expenditures during the reported quarter.
How Have Estimates Been Moving Since Then?
Following the release, investors have witnessed a downward trend in fresh estimates. There have been four revisions lower for the current quarter. In the past month, the consensus estimate has shifted by lower by 10.6% due to these changes.
VGM Scores
At this time, Weatherford's stock has a nice Growth Score of B, though it is lagging a lot on the momentum front with a D. Charting a somewhat similar path, the stock was allocated a grade of D on the value side, putting it in the bottom 40% for this investment strategy.
Overall, the stock has an aggregate VGM Score of D. If you aren't focused on one strategy, this score is the one you should be interested in.
The company's stock is suitable solely for growth investors based on our style scores.
Outlook
Estimates have been broadly trending downward for the stock. The magnitude of this revision also indicates a downward shift. Notably, the stock has a Zacks Rank #3 (Hold). We expect in-line returns from the stock in the next few months.
Weatherford International PLC (WFT): Free Stock Analysis Report
Original post
Zacks Investment Research

