Weatherford International Ltd. (WFT) is a provider of equipment and services used in the drilling, evaluation, completion, production and intervention of oil and natural gas wells. Weatherford operates in over 100 countries and has manufacturing facilities and sales, service and distribution located in the oil and natural gas producing regions throughout the world.
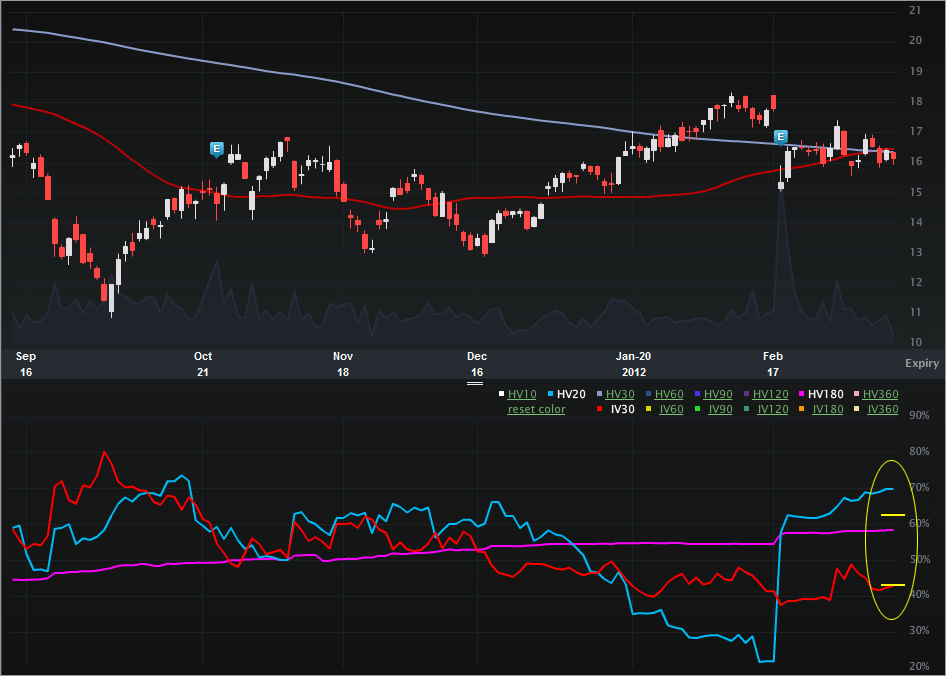
This is a vol note surrounding both depressed IV30™ (or is it?) and some interesting front month (3 day) vol. Let’s start with the Charts Tab (six months), below. The top portion is the stock price, the bottom is the vol (IV30™ - red vs HV20™ - blue vs HV180™ - pink).

On the stock side we can see the recent drop off of earnings from $17.79 to $15.36 or 13.7% in a day. Since that time, the stock has recovered slightly and more notably, has found a “quiet period.”
Looking to the vol, we can see that the IV30™ is depressed relative to both the short-term historical realized vol (HV20™) and the long-term historical realized vol (HV180™). I’ll talk about those two little horizontal marks in a sec. For completeness, the vol comps are included below (I’ve included the HV10™ as well).
IV30™: 42.93%
HV20™: 69.99%
HV180™: 58.40%
HV10™: 54.56%
The 52 wk range in IV30™ is [30.47%, 80.38%] putting the current level in the 24th percentile (annual).
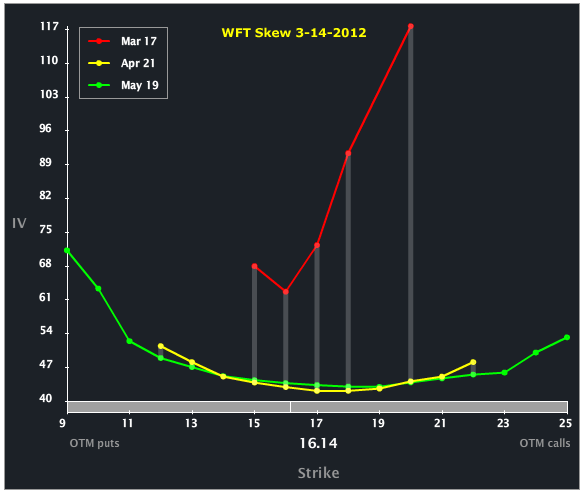
Let’s turn to the Skew Tab to examine the month-to-month and line-by-line vols.

We can see an interesting upside skew in the front. Some of that is a bit overstated due to a cab bid in the Mar 20 calls (the Mar 19 calls are no bid and therefore do not represent a data point on this skew chart). More notable to me is the holistic view that the front expiry is elevated to the back. A lot of that is attributable to impending expiration.
Looking back to the Charts Tab (above), those two horizontal hash marks in the vol portion represent the Mar and Apr vols. Keeping in mind that the HV20™ is “artificially” elevated because of that earnings move, we can see that the front expiry is priced above HV10™ and HV180™.
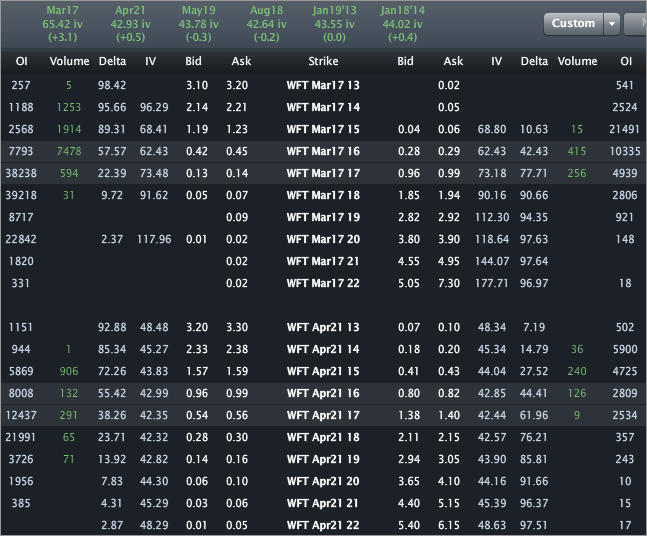
Let’s turn to the Options Tab, for completeness.

I wrote about this one for TheStreet (OptionsProfits), so no specific trade analysis here. We can see the 65.42% vs 42.93% Mar to Apr vols as well as that cab bid in the Mar 20 calls creating what looks like a crazy upside skew. A couple of things to note:
(1) Before the earnings event, HV20™ was just 21.88%.
(2) IV30™ rose to just 41.45% on the day before earnings.
Disclosure: This is trade analysis, not a recommendation
This is a vol note surrounding both depressed IV30™ (or is it?) and some interesting front month (3 day) vol. Let’s start with the Charts Tab (six months), below. The top portion is the stock price, the bottom is the vol (IV30™ - red vs HV20™ - blue vs HV180™ - pink).

On the stock side we can see the recent drop off of earnings from $17.79 to $15.36 or 13.7% in a day. Since that time, the stock has recovered slightly and more notably, has found a “quiet period.”
Looking to the vol, we can see that the IV30™ is depressed relative to both the short-term historical realized vol (HV20™) and the long-term historical realized vol (HV180™). I’ll talk about those two little horizontal marks in a sec. For completeness, the vol comps are included below (I’ve included the HV10™ as well).
IV30™: 42.93%
HV20™: 69.99%
HV180™: 58.40%
HV10™: 54.56%
The 52 wk range in IV30™ is [30.47%, 80.38%] putting the current level in the 24th percentile (annual).
Let’s turn to the Skew Tab to examine the month-to-month and line-by-line vols.

We can see an interesting upside skew in the front. Some of that is a bit overstated due to a cab bid in the Mar 20 calls (the Mar 19 calls are no bid and therefore do not represent a data point on this skew chart). More notable to me is the holistic view that the front expiry is elevated to the back. A lot of that is attributable to impending expiration.
Looking back to the Charts Tab (above), those two horizontal hash marks in the vol portion represent the Mar and Apr vols. Keeping in mind that the HV20™ is “artificially” elevated because of that earnings move, we can see that the front expiry is priced above HV10™ and HV180™.
Let’s turn to the Options Tab, for completeness.

I wrote about this one for TheStreet (OptionsProfits), so no specific trade analysis here. We can see the 65.42% vs 42.93% Mar to Apr vols as well as that cab bid in the Mar 20 calls creating what looks like a crazy upside skew. A couple of things to note:
(1) Before the earnings event, HV20™ was just 21.88%.
(2) IV30™ rose to just 41.45% on the day before earnings.
Disclosure: This is trade analysis, not a recommendation
